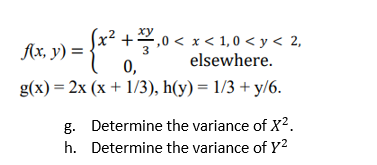
=(x, y) = { √x² +²2²2²,0 < x < 1,0 < y < 2, elsewhere. 0, (x)= 2x (x + 1/3), h(y)= 1/3 + y/6. g. Determine the variance of X². Determine the variance of Y² h.


Q: The following is a set of data from a sample of n=6. 5 2 7 5 1 13 a. Compute the first…
A:
Q: A simple random sample of size n = 40 is drawn from a population. The sample mean is found to be…
A: Given : population mean = 100
Q: Evaluate the given expression and express the result using the usual format for writing numbers…
A: we have to find out 60P2 so, we know that Prn=n!n-r!
Q: Suppose a professional golfing association requires that the standard deviation of the diameter of a…
A: Given data : sample size, n = 12 population standard deviation,σ= 0.004 sample…
Q: The following data set shows the average room price (in US$) paid by various nationalities while…
A: Given data set is 127, 103, 114, 124, 119, 116, 136, 81, 132, 95, 132, 113,139 n=No. of…
Q: The difference between the observed y-value and the y-value predicted by the linear model is called…
A:
Q: Movie companies need to predict the gross receipts of individual movies after a movie has debuted.…
A: Use EXCEL to obtain the value covariance between First weekend gross and national gross. EXCEL…
Q: The mean amount of money spent on lunch per week for a sample of 105 students is $24. If the margin…
A: Solution
Q: Determine the value of C P(1.06 ≤ Z ≤. C) = 0.1299
A: It is given that the probability value is 0.1299.
Q: Newspapers lose their credit when they are found to have published deceptive or misleading news…
A: Given information:Contigency table is given.
Q: Male BMI Female BMI μ H₁ H₂ n Given in the table are the BMI statistics for random samples of men…
A: (a) State the hypotheses.
Q: This data set describes the flight path of a balsa wood glider launched from a tower on a hilltop.…
A:
Q: A researcher wishes to estimate, with 95% confidence, the population proportion of adults who eat…
A: The objective is to estimate the sample size for the different estimated values of the sample…
Q: The number of white corpuscles on a slide has a Poisson distribution with a mean of 4.5. a. Find the…
A: Given Mean = 4.5
Q: i. j. Determine the correlation Determine the covariance of X and Y. of X and Y.
A:
Q: A binomial experiment with probability of success p=0.8 and n=7 trials is conducted. What is the…
A: Given : Probability of success,p = 0.8 Probability of failure,q=(1- 0.8)= 0.2…
Q: The Intelligence Quotient (IQ) test scores for adults are normally distributed with a population…
A: Solution-: Given: μ=100,σ=20,n=70 We want to find, P(the mean of sample less than 95)=?
Q: was conducted. The survey only includes the number of credit cards per participant. The results of…
A: The hypothesized mean is 4.
Q: The data to the right contain the state cigarette tax (in $) for all 20 regions of a country. 1.36…
A: Given that The state cigarette tax (in $) for all 20 regions of a country. 1.36 ,1.70 , 2.51 , 0.45…
Q: The number of kilograms of bananas sold by a certain fruit vendor over a year follows a Poisson…
A: Given data ison average 52 kgs of bananas per dayλ=52 kg per dayx~poisson(λ=52)
Q: C. A student conducted a regression analysis between the math grades of his classmates and the…
A: The given regression equation is y' = 97.732-2.61x.
Q: 3/4 $1 1/4 1/4 82 11/3
A: The states in the Markov Chain are: s1 s2 s3 f(s1) = Af(s2) = Bf(s3) = C s1…
Q: (b) Find the mean. Round the answer to two decimal places. The mean is X S
A: Let X denote the binomial random variable. Given that X follows Binomial(n = 11, p = 0.2)
Q: production
A: Given data: Total number technicians = 5
Q: 3. Regression: Consider following data. X 3 12 6 20 14 Y 55 40 55 10 15 The estimated regression…
A:
Q: Suppose that the number of asbestos particles in a sample of 1 squared centimeter of dust is a…
A: Solution Given That , Suppose that the number of asbestos particles in a sample of 1 squared…
Q: Past records from a local hospital stated that the proportion of full-term babies born in the…
A: GivenPast records from a local hospital stated that the proportion of full-term babies born in the…
Q: Find the mean and standard deviation of the frequency distribution X. 2 3 4 5 6 F. 3 4 2 2 1 (Round…
A:
Q: A simple random sample of size n=15 is drawn from a population that is normally distributed. The…
A: Given : population mean = 22
Q: The lengths of lumber a machine cuts are normally distributed with a mean of 105 inches and a…
A: Given,sample size(n)=35mean(μ)=105standard deviation(σ)=0.5
Q: You are hanging out with your friend on a Sat Ultimate Fighting Championship Event happe martial…
A: Answer : Q.6 1 For Male fighters (x1): sample size (n1) = 10 sample mean (x̄1) = Σx1 /n1 =…
Q: A college has decided to add support courses to its statistics classes to assist students. We look…
A: Given that: Sample size, n = 160 Sample mean, x¯=78 Sample standard deviation, s = 2
Q: nas per The pressures obtained from a manufacturing process of capillary tubes is found to be…
A:
Q: A researcher studying public opinion of proposed social security changes obtains a simple random…
A: The sample size n is 25.
Q: The accompanying table shows the numbers of male and female students in a certain region who…
A: Given data is Degrees in Field Degrees Outside of Field Total Males 161681 595900 757581…
Q: According to a recent article about individuals who have credit cards, the mean number of cards per…
A: The number of observations n is 60.
Q: Determine the range, mean, and standard deviation of the data set. {9,5,9,17,17,16,3,8}
A: Given n=8 9,5,9,17,17,16,3,8
Q: A company is in the business of finding addresses of long-lost friends. The company claims to have a…
A: Solution Given that, A company is in the business of finding addresses of long-lost friends. The…
Q: ence interval using a 99% confidence level. What does the idence interval tell about the population…
A:
Q: In 1945, an organization asked 1504 randomly sampled American citizens, "Do you think we can develop…
A: Given : population proportion = 0.5
Q: of time (in years) it took a random sample of 32 former smokers to quit smoking permanently are…
A:
Q: Question 6 The researchers further believe that the mean bill lengths for the 3 species are…
A: Given information: No. of species=03Means, Species Adelie=μ1Species Gentoo=μ2Species Chinstrap=μ3
Q: The table given below shows the data obtained during the outbreak of smallpox: Test the…
A: Solution-: Given: α=0.01 (Or 1%) We have following table: Attacked Not Attacked Total…
Q: X f(x, y) 2 4 1 0.10 0.15 y 3 0.20 0.30 5 0.10 0.15 e. Determine the conditional distribution of f…
A: Farmula used P(X/Y=y)=P(X,Y=y)/P(Y=y)
Q: The UWI Open Campus has commissioned a study to determine how student will perform in ECON3080 based…
A: The UWI Open Campus has commissioned a study to determine how student will perform in ECON3080 based…
Q: A team is being formed that includes six different people. There are six different positions on the…
A: Permutation: It is nothing but the arrangement of items in a definite order where the order is…
Q: Suppose that in a random selection of 100 colored candies, 25% of them are blue. The candy company…
A:
Q: Trains arrive at a major train-station randomly and independently; the probability of an arrival is…
A: GivenMean arrival rate is 5 trains per hourλ=5 trains per hour Let "x" be no.of trains will arrive…
Q: 1. A spot speed study for 250 vehicles was conducted at Taman Universiti. The result yields average…
A:
Q: The Office of Student Services at a large western state university maintains information on the…
A: Given problem is normal distribution Let X: time of undergraduate students study per week…

Step by step
Solved in 2 steps with 2 images

- f(X)= 3/8( 4x - 2x2 ) 0<* x <* 2 (* less or equal to) a. Find the variance of X.Let X have a mean of 13 and a variance of 1.1. Let Y have a mean of 9.1 and a variance of 0.75. The covariance of x and y is 0.35. Let Z=4X – 5Y+2. What is the mean and variance of Z?Find the variance of X + 3Y + Z + 6 in terms of the variances and covariances of X, Y, and Z.
- INV 2-3c Suppose that the index model for two Canadian stocks HD and ML is estimated with the following results: RHD =0.02+0.80RM+eHD R-squared =0.6 RML =-0.03+1.50RM+eML R-squared =0.4 σM =0.20 where M is S&P/TSX Comp Index and RX is the excess return of stock X. c. What is the covariance and the correlation coefficient between HD and ML?INV 2-3a Suppose that the index model for two Canadian stocks HD and ML is estimated with the following results: RHD =0.02+0.80RM+eHD R-squared =0.6 RML =-0.03+1.50RM+eML R-squared =0.4 σM =0.20 where M is S&P/TSX Comp Index and RX is the excess return of stock X. a. What is the standard deviation of each stock? (Hint: bi = (ρiM σi) / σM.)Why the following assumptions must be met in order for us to use linear regression? The errors e1,…,en are random and independent. In particular, the magnitude of any error ei does not influence the value of the next error ei + 1. The errors e1,…,en all have mean 0. The errors e1,…,en all have the same variance, which we denote by o2. The errors e1,…,en are normally distributed
- 3. Two variables, xx and yy, have a correlation of 0.75. If xx has a mean of 25 and a standard deviation of 3, and yy has a mean of 12 and a standard deviation of 6, which of the following is the least-squares regression line for the two variables? (A) \hat y = -25.5+1.5xy^=−25.5+1.5x (B) \hat y = 12+1.5xy^=12+1.5x (C) \hat y = 12+0.75xy^=12+0.75x (D) \hat y = 16+0.75xy^=16+0.75x (E) Not enough informationWhy the following assumptions must be met in order for us to use linear regression?The errors ε1,…,εn are random and independent. In particular, the magnitude of any error ei does not influence the value of the next error εi + 1.The errors ε1,…,εn all have a mean of 0.The errors ε1,…,εn all have the same variance, which we denote by σ2.The errors ε1,…,εn are normally distributedConsider the Categorical Variable County Classification with the following categories : Urban , Suburban Exurban , and Rural . The dependent variable in the Linear Regression is the percentage of the population under 18 years of age in decimal form . Suppose Urban is the excluded category . The coefficient on Suburban is 0.07 . The coefficient on Exurban is -0.002 . The coefficient on Rural is -0.12. What is the interpretation of the coefficient on Suburban ? A. Suburban counties have a 7 percentage point higher population under 18 years of age compared to Urban counties B. Suburban counties have a 7 percentage point higher population under 18 years of age compared to Rural counties C. Urban counties have a 7 percentage point higher population under 18 years of age compared to Suburban counties D. There no way to determine from these results how the percentage of the population under 18 years of age is different in different county classifications
- Compute the mean and variance for the linear function W = 2X - 4Y. (See Image)Given pdf f (x) = 1.5x2 for −1< x < 1. Determine variance of X.The index model has been estimated for stocks A and B with the following results: RA = 0.03 + 0.8RM + eA. RB = 0.01 + 0.9RM + eB. σM = 0.35; σ(eA) = 0.20; σ(eB) = 0.10. The covariance between the returns on stocks A and B is A) 0384. B) 0.0406. C) 0.0882. D) 0.0772. E) 0.4000. 2) Analysts may use regression analysis to estimate the index model for a stock. When doing so, the slope of the regression line is an estimate of A) the α of the asset. B) the β of the asset. C) the σ of the asset. D) the δ of the asset. Choose correct answer with justification.