Xbar/R Chart for C6-C9 UCL=24.94 24 Mean-23.93 23 LCL-22.91 Subgroup UCL-3.176 R-1.302 LCL 0 Sample Range Sample Mean
Xbar/R Chart for C6-C9 UCL=24.94 24 Mean-23.93 23 LCL-22.91 Subgroup UCL-3.176 R-1.302 LCL 0 Sample Range Sample Mean

Glencoe Algebra 1, Student Edition, 9780079039897, 0079039898, 2018
18th Edition
ISBN:9780079039897
Author:Carter
Publisher:Carter
Chapter10: Statistics
Section10.3: Measures Of Spread
Problem 1GP

Related questions
Question
Pls help ASAP. Look at both images.
Transcribed Image Text:Xbar/R Chart for C6-C9
25
UCL=24.04
24
Mean-23.93
23
LCL=2291
Subgroup
10
UCL-3,17
R=1.302
LCL=0
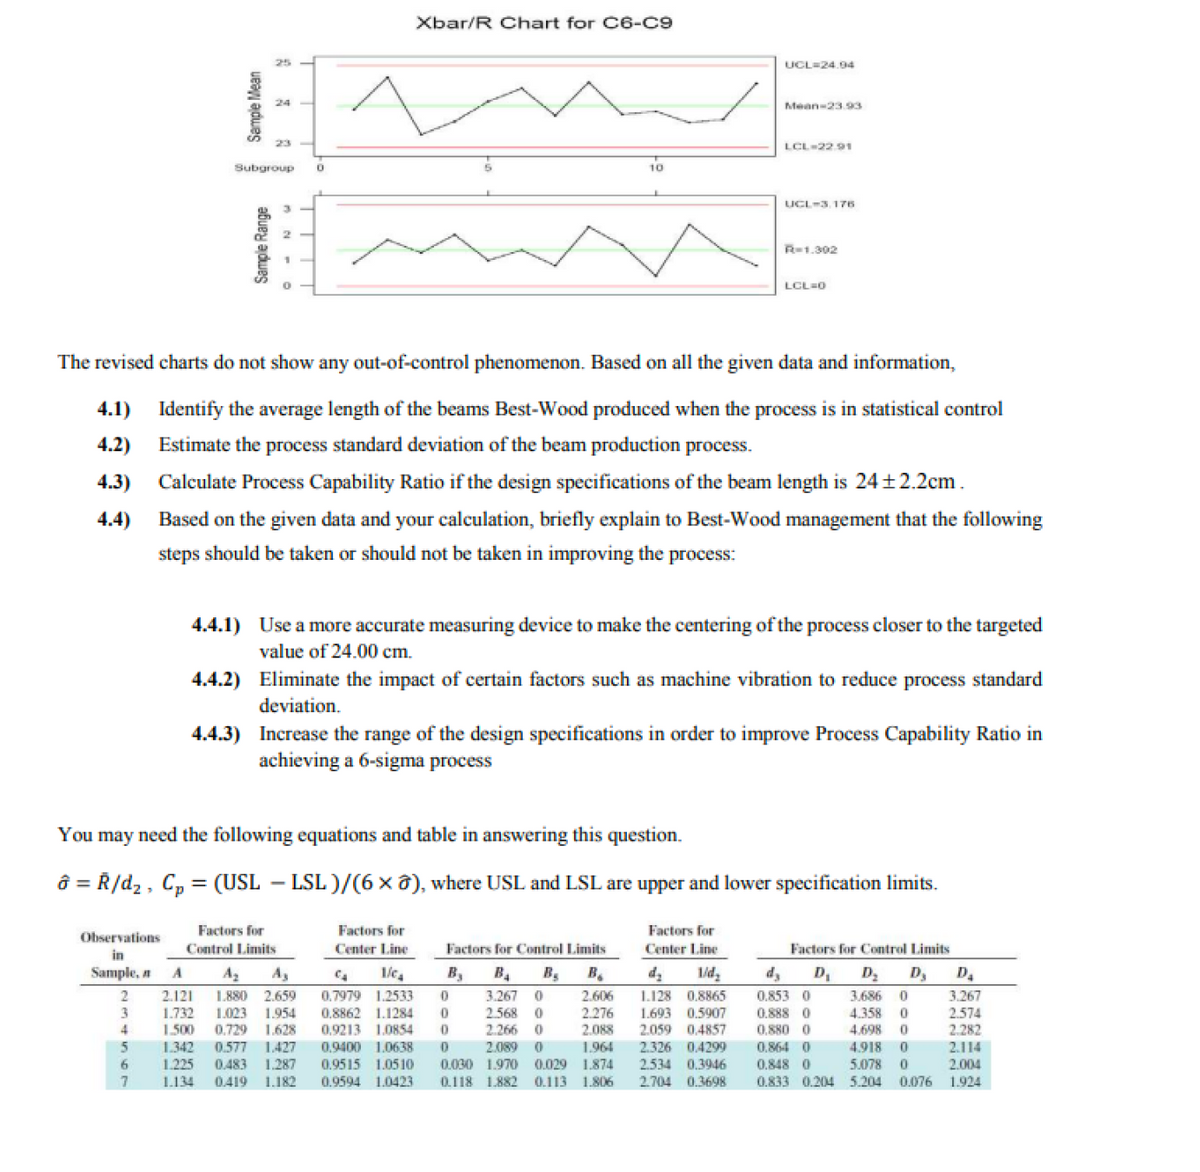
The revised charts do not show any out-of-control phenomenon. Based on all the given data and information,
4.1)
Identify the average length of the beams Best-Wood produced when the process is in statistical control
4.2)
Estimate the process standard deviation of the beam production process.
4.3)
Calculate Process Capability Ratio if the design specifications of the beam length is 24±2.2cm.
4.4)
Based on the given data and your calculation, briefly explain to Best-Wood management that the following
steps should be taken or should not be taken in improving the process:
4.4.1) Use a more accurate measuring device to make the centering of the process closer to the targeted
value of 24.00 cm.
4.4.2) Eliminate the impact of certain factors such as machine vibration to reduce process standard
deviation.
4.4.3) Increase the range of the design specifications in order to improve Process Capability Ratio in
achieving a 6-sigma process
You may need the following equations and table in answering this question.
ô = R/d2, C, = (USL – LSL )/(6 x ô), where USL and LSL are upper and lower specification limits.
Factors for
Factors for
Factors for
Observations
Control Limits
Center Line
Factors for Control Limits
Center Line
Factors for Control Limits
in
Sample, a
B,
B.
B,
B.
/d
d,
D,
D
D,
D.
3.267
3.267 0
2.568 0
2.121
1.880 2.659
0.7979 1.2533
2.606
L.128 0.8865
0.853 0
0.888 0
3.686
1.732
1.500
1.342
1.023
1.954
0.729 1.628
2.276
2.088
1.964
3
0.8862 1.1284
0,9213 1.0854
1.693 0.5907
2.059 0.4857
4.358
4.698
2.574
2.282
2.266
2.089
0.030 1.970
4
0,880 0
0.577
0.483
1.427
1.287
0.9400 1.0638
0.9515 1.0510
2.326 0.4299
2.534 0.3946
2.704 0.3698
0.864 0
4.918
5.078
2.114
2.004
0.076 1.924
1.225
0.029 1.874
0.848 0
1.134
0.419
1.182
0.9594 1.0423
0.118 1.882 0.113 1.806
0.833 0.204 5.204
Sample Range
Sample Mean
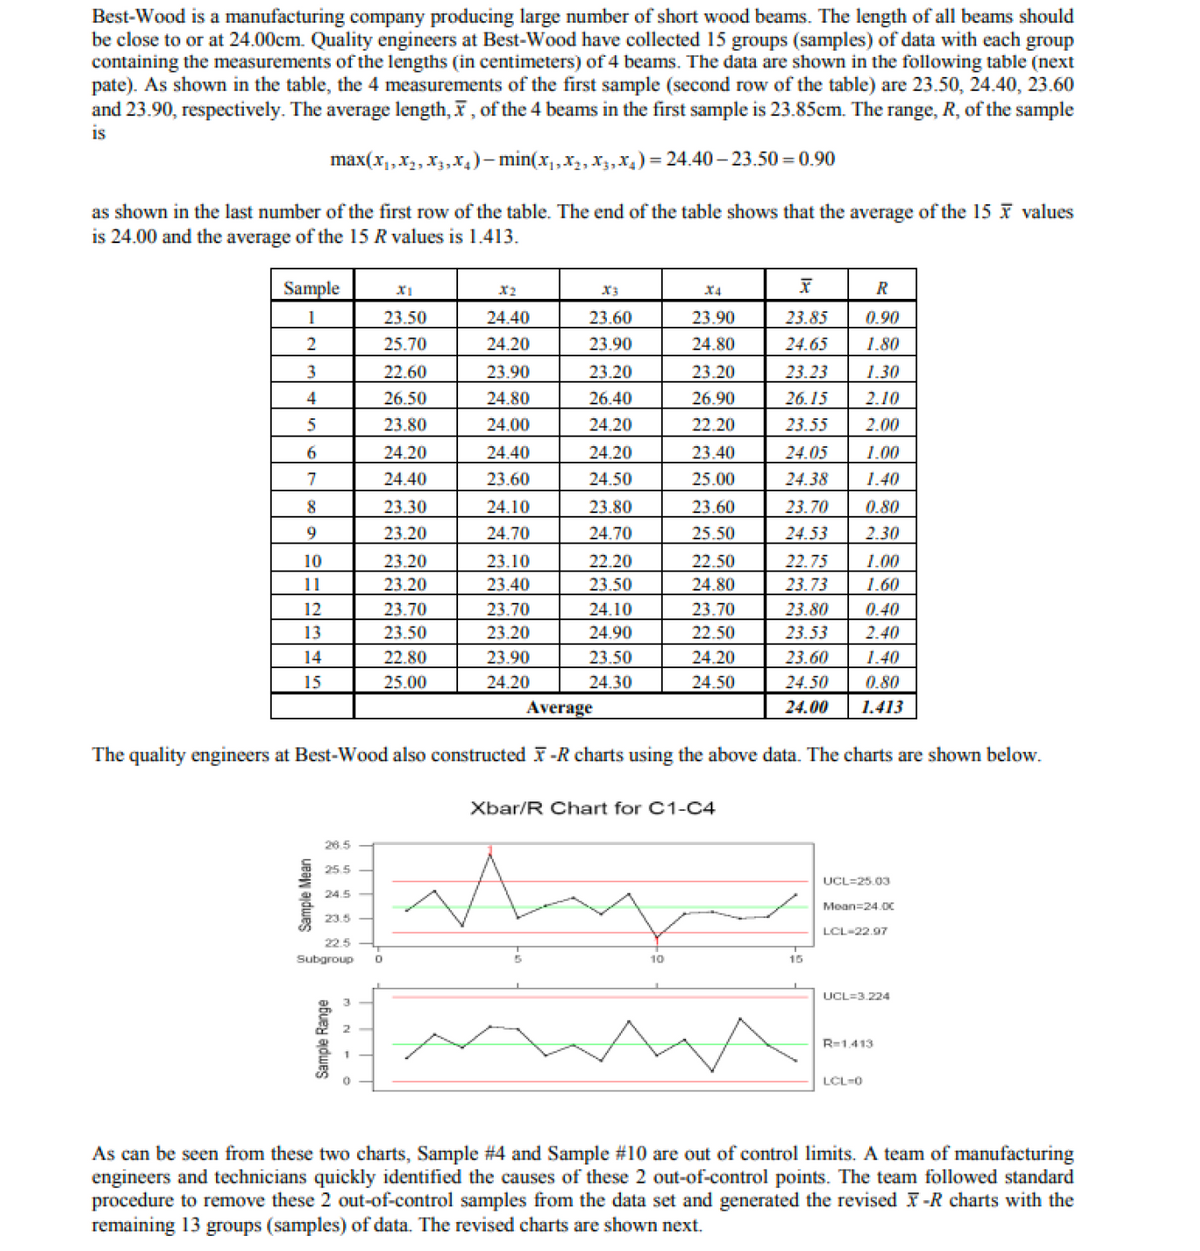
Transcribed Image Text:Best-Wood is a manufacturing company producing large number of short wood beams. The length of all beams should
be close to or at 24.00cm. Quality engineers at Best-Wood have collected 15 groups (samples) of data with each group
containing the measurements of the lengths (in centimeters) of 4 beams. The data are shown in the following table (next
pate). As shown in the table, the 4 measurements of the first sample (second row of the table) are 23.50, 24.40, 23.60
and 23.90, respectively. The average length, I, of the 4 beams in the first sample is 23.85cm. The range, R, of the sample
is
max(x,,x,, x3,x,)- min(x,,x,, X3,x,)= 24.40 – 23.50 = 0.90
as shown in the last number of the first row of the table. The end of the table shows that the average of the 15 x values
is 24.00 and the average of the 15 R values is 1.413.
Sample
X2
X4
1
23.50
24.40
23.60
23.90
23.85
0.90
25.70
24.20
23.90
24.80
24.65
1.80
22.60
23.90
23.20
23.20
23.23
1.30
4
26.50
24.80
26.40
26.90
26.15
2.10
23.80
24.00
24.20
22.20
23.55
2.00
6.
24.20
24.40
24.20
23.40
24.05
1.00
7
24.40
23.60
24.50
25.00
24.38
1.40
8
23.30
24.10
23.80
23.60
23.70
0.80
9
23.20
24.70
24.70
25.50
24.53
2.30
10
23.20
23.10
22.20
22.50
22.75
1.00
11
23.20
23.40
23.50
24.80
23.73
1.60
12
23.70
23.70
24.10
23.70
23.80
0.40
13
23.50
23.20
24.90
22.50
23.53
2.40
14
22.80
23.90
23.50
24.20
23.60
1.40
15
25.00
24.20
24.30
24.50
24.50
0.80
Average
24.00
1.413
The quality engineers at Best-Wood also constructed F-R charts using the above data. The charts are shown below.
Xbar/R Chart for C1-C4
26.5
25.5
UCL=25.03
24.5
Mean=24.0
23.5
LCL-22.97
22.5
Subgroup
10
15
UCL=3.224
R=1,413
LCL-0
As can be seen from these two charts, Sample #4 and Sample #10 are out of control limits. A team of manufacturing
engineers and technicians quickly identified the causes of these 2 out-of-control points. The team followed standard
procedure to remove these 2 out-of-control samples from the data set and generated the revised X -R charts with the
remaining 13 groups (samples) of data. The revised charts are shown next.
Sample Range
Expert Solution
This question has been solved!
Explore an expertly crafted, step-by-step solution for a thorough understanding of key concepts.

Step by step
Solved in 5 steps

Recommended textbooks for you
Glencoe Algebra 1, Student Edition, 9780079039897…
Algebra
ISBN:
9780079039897
Author:
Carter
Publisher:
McGraw Hill

College Algebra (MindTap Course List)
Algebra
ISBN:
9781305652231
Author:
R. David Gustafson, Jeff Hughes
Publisher:
Cengage Learning
Glencoe Algebra 1, Student Edition, 9780079039897…
Algebra
ISBN:
9780079039897
Author:
Carter
Publisher:
McGraw Hill
College Algebra (MindTap Course List)
Algebra
ISBN:
9781305652231
Author:
R. David Gustafson, Jeff Hughes
Publisher:
Cengage Learning