Xi Yi Hint(s) Check M 9 15 17 20 57 40 21 15 % of the variability in y has been explained by the estimated regression equation (to 1 decimal). Given are five observations for two variables, and y. The estimated regression equation for these data is ŷ = 74.06 - 2.79x. a. Compute SSE, SST, and SSR. SSE (to 2 decimals) SST (to 2 decimals) SSR * (to 2 decimals) b. Compute the coefficient of determination 72. Comment on the goodness of fit. (to 3 decimals) fit; The least squares line provided an good c. Compute the sample correlation coefficient. Enter negative value as negative number. (to 3 decimals) 4 56
Xi Yi Hint(s) Check M 9 15 17 20 57 40 21 15 % of the variability in y has been explained by the estimated regression equation (to 1 decimal). Given are five observations for two variables, and y. The estimated regression equation for these data is ŷ = 74.06 - 2.79x. a. Compute SSE, SST, and SSR. SSE (to 2 decimals) SST (to 2 decimals) SSR * (to 2 decimals) b. Compute the coefficient of determination 72. Comment on the goodness of fit. (to 3 decimals) fit; The least squares line provided an good c. Compute the sample correlation coefficient. Enter negative value as negative number. (to 3 decimals) 4 56

College Algebra
7th Edition
ISBN:9781305115545
Author:James Stewart, Lothar Redlin, Saleem Watson
Publisher:James Stewart, Lothar Redlin, Saleem Watson
Chapter1: Equations And Graphs
Section: Chapter Questions
Problem 10T: Olympic Pole Vault The graph in Figure 7 indicates that in recent years the winning Olympic men’s...

Related questions
Question
Transcribed Image Text:7
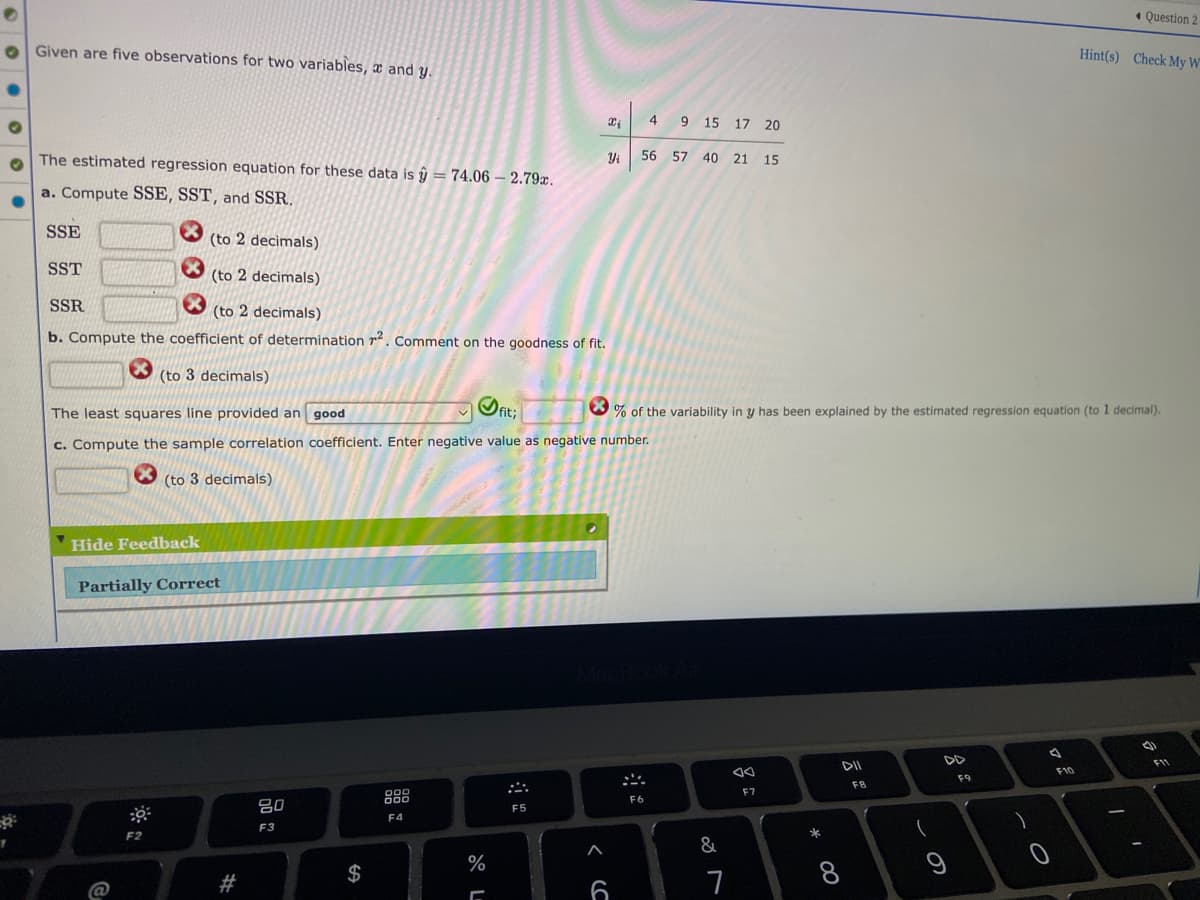
Given are five observations for two variables, and y.
The estimated regression equation for these data is ŷ = 74.06 - 2.79x.
a. Compute SSE, SST, and SSR.
SSE
(to 2 decimals)
SST
(to 2 decimals)
SSR
(to 2 decimals)
b. Compute the coefficient of determination 7². Comment on the goodness of fit.
*
(to 3 decimals)
The least squares line provided an good
fit;
c. Compute the sample correlation coefficient. Enter negative value as negative number.
(to 3 decimals)
Hide Feedback
Partially Correct
DOD
000
F5
F4
@
O:
F2
C
#
80
F3
$
Question 2
Hint(s) Check My W
4
9 15 17 20
56 57 40 21 15
% of the variability in y has been explained by the estimated regression equation (to 1 decimal).
A
AA
DII
۴۹۹
F7
%
[
Xi
Yi
6
F6
&
7
*
FB
9
F9
-0
F10
-
1
Expert Solution
This question has been solved!
Explore an expertly crafted, step-by-step solution for a thorough understanding of key concepts.

Step by step
Solved in 2 steps with 1 images

Recommended textbooks for you
College Algebra
Algebra
ISBN:
9781305115545
Author:
James Stewart, Lothar Redlin, Saleem Watson
Publisher:
Cengage Learning

Linear Algebra: A Modern Introduction
Algebra
ISBN:
9781285463247
Author:
David Poole
Publisher:
Cengage Learning

Glencoe Algebra 1, Student Edition, 9780079039897…
Algebra
ISBN:
9780079039897
Author:
Carter
Publisher:
McGraw Hill
College Algebra
Algebra
ISBN:
9781305115545
Author:
James Stewart, Lothar Redlin, Saleem Watson
Publisher:
Cengage Learning
Linear Algebra: A Modern Introduction
Algebra
ISBN:
9781285463247
Author:
David Poole
Publisher:
Cengage Learning
Glencoe Algebra 1, Student Edition, 9780079039897…
Algebra
ISBN:
9780079039897
Author:
Carter
Publisher:
McGraw Hill