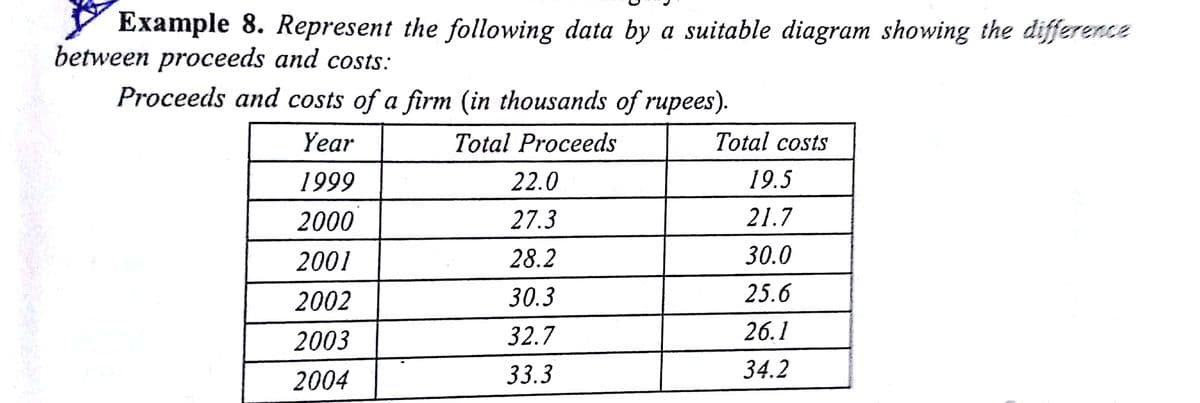
Y Example 8. Represent the following data by a suitable diagram showing the difference between proceeds and costs: Proceeds and costs of a firm (in thousands of rupees). Year Total Proceeds Total costs 1999 22.0 19.5 2000 27.3 21.7 2001 28.2 30.0 2002 30.3 25.6 2003 32.7 26.1 2004 33.3 34.2
Y Example 8. Represent the following data by a suitable diagram showing the difference between proceeds and costs: Proceeds and costs of a firm (in thousands of rupees). Year Total Proceeds Total costs 1999 22.0 19.5 2000 27.3 21.7 2001 28.2 30.0 2002 30.3 25.6 2003 32.7 26.1 2004 33.3 34.2

Glencoe Algebra 1, Student Edition, 9780079039897, 0079039898, 2018
18th Edition
ISBN:9780079039897
Author:Carter
Publisher:Carter
Chapter10: Statistics
Section: Chapter Questions
Problem 8SGR

Related questions
Question
Transcribed Image Text:Example 8. Represent the following data by a suitable diagram showing the difference
between proceeds and costs:
Proceeds and costs of a firm (in thousands of rupees).
Year
Total Proceeds
Total costs
1999
22.0
19.5
2000
27.3
21.7
2001
28.2
30.0
2002
30.3
25.6
2003
32.7
26.1
2004
33.3
34.2
Expert Solution
This question has been solved!
Explore an expertly crafted, step-by-step solution for a thorough understanding of key concepts.

Step by step
Solved in 2 steps with 2 images

Recommended textbooks for you
Glencoe Algebra 1, Student Edition, 9780079039897…
Algebra
ISBN:
9780079039897
Author:
Carter
Publisher:
McGraw Hill
Glencoe Algebra 1, Student Edition, 9780079039897…
Algebra
ISBN:
9780079039897
Author:
Carter
Publisher:
McGraw Hill