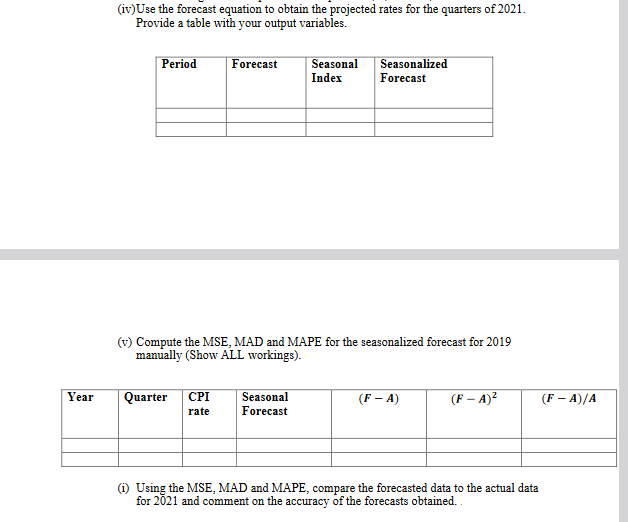
Year (iv) Use the forecast equation to obtain the projected rates for the quarters of 2021. Provide a table with your output variables. Period Forecast Seasonal Index Quarter CPI Seasonal rate Forecast Seasonalized Forecast (v) Compute the MSE, MAD and MAPE for the seasonalized forecast for 2019 manually (Show ALL workings). [ (F-A) (F-A)² (i) Using the MSE, MAD and MAPE, compare the forecasted data to the actual data for 2021 and comment on the accuracy of the forecasts obtained. (F-A)/A
Year (iv) Use the forecast equation to obtain the projected rates for the quarters of 2021. Provide a table with your output variables. Period Forecast Seasonal Index Quarter CPI Seasonal rate Forecast Seasonalized Forecast (v) Compute the MSE, MAD and MAPE for the seasonalized forecast for 2019 manually (Show ALL workings). [ (F-A) (F-A)² (i) Using the MSE, MAD and MAPE, compare the forecasted data to the actual data for 2021 and comment on the accuracy of the forecasts obtained. (F-A)/A
Chapter6: Exponential And Logarithmic Functions
Section6.8: Fitting Exponential Models To Data
Problem 1TI: Table 2 shows a recent graduate’s credit card balance each month after graduation. a. Use...
Related questions
Question
| Year | Consumer price index |
| 2001 | 0.9576707944 |
| 2001 | 1.043445267 |
| 2001 | 0.1314307172 |
| 2001 | -0.2812675892 |
| 2002 | 0.3572771719 |
| 2002 | 1.086752857 |
| 2002 | 0.4263206673 |
| 2002 | 0.3137689184 |
| 2003 | 1.011959522 |
| 2003 | 0.364298725 |
| 2003 | 0.4900181488 |
| 2003 | 0.01806032147 |
| 2004 | 0.9028530155 |
| 2004 | 1.431639227 |
| 2004 | 0.352858151 |
| 2004 | 0.5977496484 |
| 2005 | 0.6291506466 |
| 2005 | 1.337269885 |
| 2005 | 1.216795201 |
| 2005 | 0.5079580088 |
| 2006 | 0.539083558 |
| 2006 | 1.692359249 |
| 2006 | 0.5602240896 |
| 2006 | -0.8520399803 |
| 2007 | 1.019170385 |
| 2007 | 1.917329089 |
| 2007 | 0.2759287112 |
| 2007 | 1.711214555 |
| 2008 | 1.136773642 |
| 2008 | 2.195344656 |
| 2008 | 1.163055346 |
| 2008 | -2.828529429 |
| 2009 | -0.497633075 |
| 2009 | 1.060302337 |
| 2009 | 0.6790719816 |
| 2009 | 0.2011885888 |
| 2010 | 0.4014150536 |
| 2010 | 0.4750721517 |
| 2010 | 0.09325049836 |
| 2010 | 0.2949163207 |
| 2011 | 1.264822375 |
| 2011 | 1.743310892 |
| 2011 | 0.4085179843 |
| 2011 | -0.1520557705 |
| 2012 | 0.7956386559 |
| 2012 | 0.8275317381 |
| 2012 | 0.219328148 |
| 2012 | 0.03604046954 |
| 2013 | 0.5903298758 |
| 2013 | 0.5409806119 |
| 2013 | 0.3779793413 |
| 2013 | -0.2790676461 |
| 2014 | 0.7612225297 |
| 2014 | 1.180867814 |
| 2014 | 0.1146758445 |
| 2014 | -0.8033517566 |
| 2015 | -0.5431990017 |
| 2015 | 1.205595644 |
| 2015 | 0.2626773738 |
| 2015 | -0.4498436877 |
| 2016 | 0.06463406581 |
| 2016 | 1.172350557 |
| 2016 | 0.3326819411 |
| 2016 | 0.2225741972 |
| 2017 | 0.790736963 |
| 2017 | 0.5435177058 |
| 2017 | 0.3966156914 |
| 2017 | 0.3706296363 |
| 2018 | 0.8861183798 |
| 2018 | 1.033075567 |
| 2018 | 0.3272675678 |
| 2018 | -0.05749473626 |
| 2019 | 0.3351160343 |
| 2019 | 1.198513227 |
| 2019 | 0.2741660078 |
| 2019 | 0.2130179974 |
| 2020 | 0.4194274219 |
| 2020 | -0.5400354172 |
| 2020 | 1.131485375 |
| 2020 | 0.2299502502 |
Using this information provided above please provide solutions for the questions in screen shot.

Transcribed Image Text:Year
(iv) Use the forecast equation to obtain the projected rates for the quarters of 2021.
Provide a table with your output variables.
Period
Forecast
Quarter CPI
rate
Seasonal
Index
(v) Compute the MSE, MAD and MAPE for the seasonalized forecast for 2019
manually (Show ALL workings).
Seasonal
Forecast
Seasonalized
Forecast
(F-A)
(F - A)²
(1) Using the MSE, MAD and MAPE, compare the forecasted data to the actual data
for 2021 and comment on the accuracy of the forecasts obtained.
(F - A)/A
Expert Solution
This question has been solved!
Explore an expertly crafted, step-by-step solution for a thorough understanding of key concepts.
Step by step
Solved in 4 steps with 10 images

Recommended textbooks for you


Algebra & Trigonometry with Analytic Geometry
Algebra
ISBN:
9781133382119
Author:
Swokowski
Publisher:
Cengage


Algebra & Trigonometry with Analytic Geometry
Algebra
ISBN:
9781133382119
Author:
Swokowski
Publisher:
Cengage