Years of Experience Salesperson Annual Sales ($1,000s) 80 2. 97 102 4 107 6. 103 101 10 119 10 128 9. 11 127 10 13 136
Years of Experience Salesperson Annual Sales ($1,000s) 80 2. 97 102 4 107 6. 103 101 10 119 10 128 9. 11 127 10 13 136

Glencoe Algebra 1, Student Edition, 9780079039897, 0079039898, 2018
18th Edition
ISBN:9780079039897
Author:Carter
Publisher:Carter
Chapter4: Equations Of Linear Functions
Section4.6: Regression And Median-fit Lines
Problem 4GP

Related questions
Question
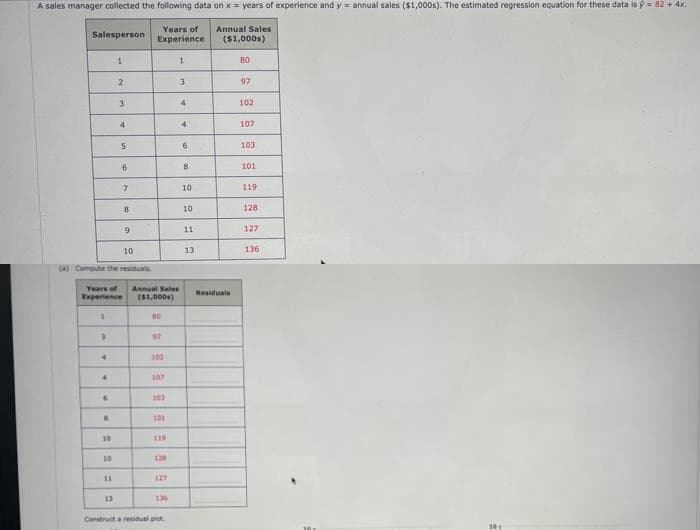
Transcribed Image Text:A sales manager collected the following data on x = years of experience and y = annual sales ($1,000s). The estimated regression equation for these data is ý = 82 + 4x.
Years of
Experience
Annual Sales
Salesperson
($1,000s)
80
2
3.
97
102
4
4
107
103
101
10
119
8.
10
128
6.
11
127
10
13
136
(a) Compute the residuals
Years of
Annual Sales
Residuais
Experience
(S1,000s)
97
4.
102
107
103
101
10
119
10
126
11
127
13
136
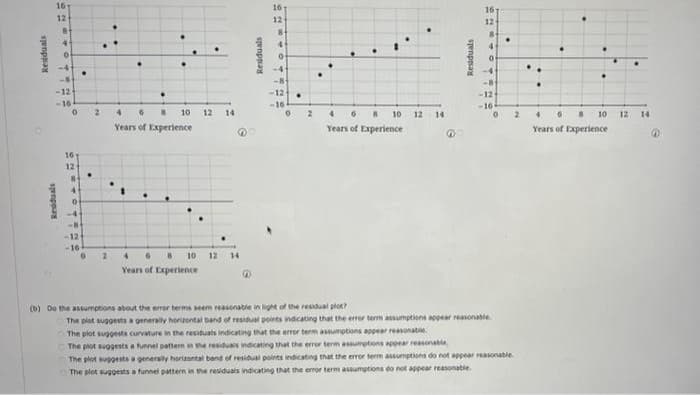
Construct a residual plot.
Transcribed Image Text:16
16
16
12
12
12
8-
-4'
-4
-4
-8
-12
-12
-16
-16
10
12
14
10 12
Years of Experience
14
10
12
14
Years of Experience
Years of Experience
16
12
4.
-4
-84
-12
-16
6 8 10 12 14
Years of Experience
(b) Do the assumptions about the errer terms seem reasonable in light of the residual plot?
The plat suggests a generally horzontal band of residual points indicating that the error term assumptions apear reasonable
The plot suggests curvature in the residuals indicating that the errer tem asumptions appear reasonatle
The plot seggests a funnel patterm in the residuals indicating that the error term assumptions appeer reasonable
The plot suggests a generaly horizontal bend of residual points indicating that the error term assumptions do not appear reasonable
The plot suggests a funnel pattern in the residuals indicating that the enror term assumgtions do not agpear reasonabie.
spenppag
Senpsay
Expert Solution
This question has been solved!
Explore an expertly crafted, step-by-step solution for a thorough understanding of key concepts.

This is a popular solution!

Trending now
This is a popular solution!

Step by step
Solved in 2 steps

Recommended textbooks for you
Glencoe Algebra 1, Student Edition, 9780079039897…
Algebra
ISBN:
9780079039897
Author:
Carter
Publisher:
McGraw Hill

Linear Algebra: A Modern Introduction
Algebra
ISBN:
9781285463247
Author:
David Poole
Publisher:
Cengage Learning

Glencoe Algebra 1, Student Edition, 9780079039897…
Algebra
ISBN:
9780079039897
Author:
Carter
Publisher:
McGraw Hill
Linear Algebra: A Modern Introduction
Algebra
ISBN:
9781285463247
Author:
David Poole
Publisher:
Cengage Learning

Algebra & Trigonometry with Analytic Geometry
Algebra
ISBN:
9781133382119
Author:
Swokowski
Publisher:
Cengage

Functions and Change: A Modeling Approach to Coll…
Algebra
ISBN:
9781337111348
Author:
Bruce Crauder, Benny Evans, Alan Noell
Publisher:
Cengage Learning

College Algebra
Algebra
ISBN:
9781305115545
Author:
James Stewart, Lothar Redlin, Saleem Watson
Publisher:
Cengage Learning