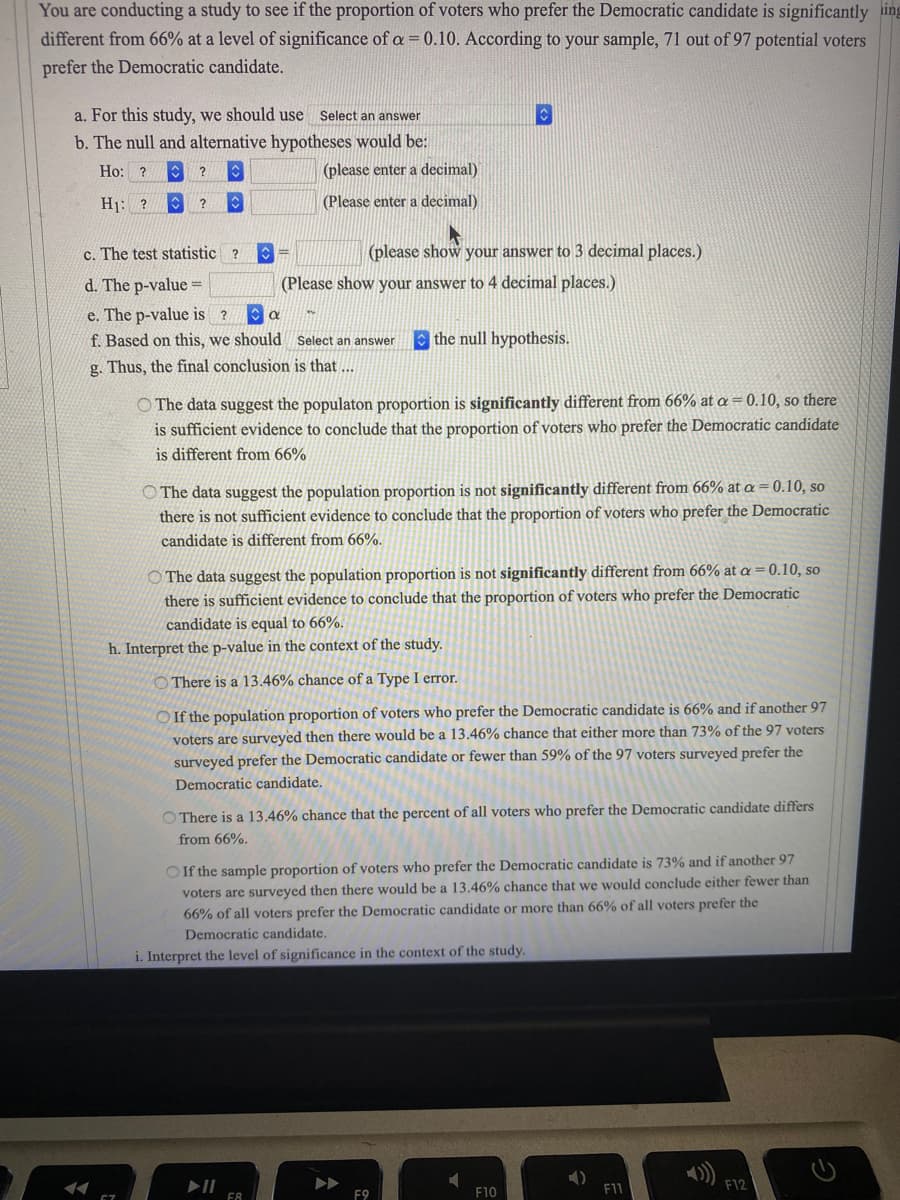
You are conducting a study to see if the proportion of voters who prefer the Democratic candidate is significantly different from 66% at a level of significance of a = 0.10. According to your sample, 71 out of 97 potential voters prefer the Democratic candidate. a. For this study, we should use Select an answer b. The null and alternative hypotheses would be: Ho: ? (please enter a decimal) H1: ? (Please enter a decimal) c. The test statistic ? (please show your answer to 3 decimal places.)


Since you have posted a question with multiple sub-parts, we will solve first three sub-parts for you. To get remaining sub-part solved please repost the complete question and mention the sub-parts to be solved.
a.
A study is conducted to determine whether the proportion of voters who prefer Democratic candidate is significantly different from . A sample of 97 voters is considered in which 71 have preferred Democratic candidate.
Since the sample proportion is to be compared with population proportion, one sample proportion z test has to be used for testing.
Thus, for this study, we should use one sample proportion z test.
b.
Let p denote the population proportion of voters who prefer Democratic candidate. About 66% of the voters prefer Democratic candidate.
Null hypothesis:
Alternative hypothesis:

Step by step
Solved in 3 steps


