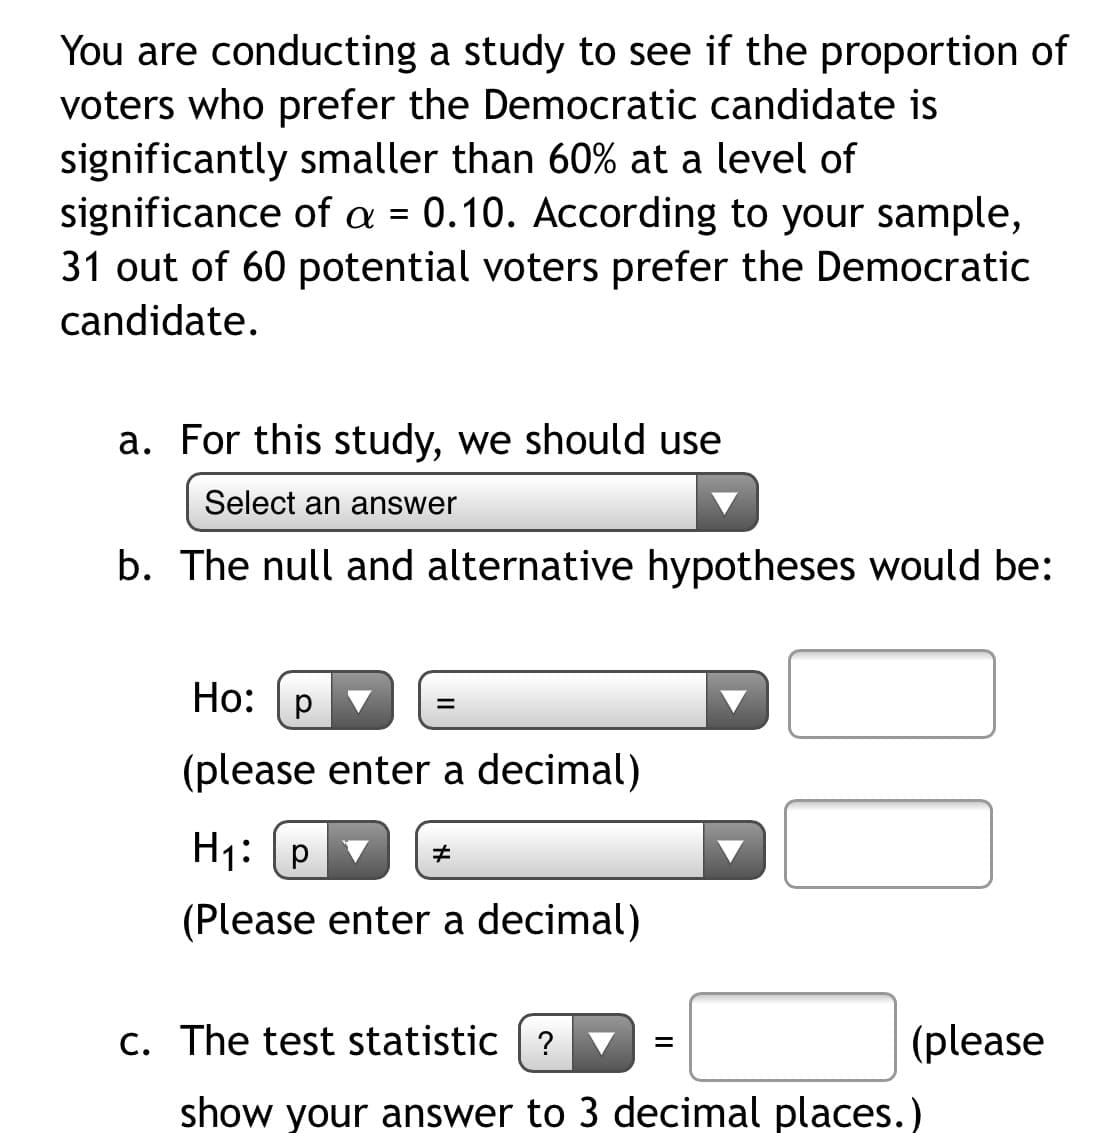
You are conducting a study to see if the proportion of voters who prefer the Democratic candidate is significantly smaller than 60% at a level of significance of a = 0.10. According to your sample, 31 out of 60 potential voters prefer the Democratic candidate.


Q: A researcher is studying two types of medication that both treat hives. 23 out of the random sample…
A: It is given that: The level of significance (L) is 0.01.
Q: .What percentage of females are smokers? 2.What percentage of people who do not smoke are males?…
A: Cross tabulation helps a researcher to analyze the results of bivariate relationship between the…
Q: For a Bernoulli process with success rate .4, what is the variance in the number of trials we need…
A: Given: P= 0.40 The variance can be calculated as: Variance = p(1-p) = 0.40*(1-0.40) = 0.4*0.6 = 0.24…
Q: If the statistical analysis shows that the percentage of men taking Vitamin E who de- veloped…
A: The researchers conducted a designed experiment by randomly selecting the healthy men from different…
Q: Suppose a population has three values 13, 17 and 24. What is its variance?
A: Given: n=3 The mean of the data is obtained as below: Mean=∑xn=13+17+243=543=18 The mean is 18.
Q: tudies if age correlates with the average number of hours of sleep, so she selected a random sample…
A: Given: sample size(n)=10 Age(x) Hours of sleep(y) xy x^2 y^2 8 8 64 64 64 15 8 120 225…
Q: What are the advantages of conducting experiments with more than two groups or conditions?
A: To find: What are the advantages of conducting experiments with more than two groups or conditions?
Q: In 1940, 2,000 women working in a factory were recruited into a study. Half of the women worked in…
A: Solution: option c is correct:
Q: In the 5 models above, which variable, by itself, explains the greatest proportion of total variance…
A: Predictor P for variable X3 is larger among all other variables. Hence variable X3 explains that…
Q: Which is the most striking feature of a two-factor ANOVA?
A:
Q: The researchers hypothesized that there would be a correlation between how much people studied and…
A: Solution: From the given information, the researchers hypothesized that there would be a correlation…
Q: In a clinical trial, 22 out of 852 patients taking a prescription drug daily complained of flulike…
A: Given that, x = 22, n =852
Q: Describe a business scenario where you would have to test more than two samples of data. What type…
A: Given information: The investigator is specially interested describe a scenario to test more than…
Q: Range of ankle motion is a contributing factor to falls among the elderly. Suppose a team of…
A:
Q: How many separate groups of participants would be needed for a two-factor ANOVA with 3 levels of…
A: How many separate groups of participants would be needed for a two-factor ANOVA with 3 levels of…
Q: If a treatment is expected to decrease scores on a variable for which the mean is expected to be…
A: Given: μ=50 If a treatment is expected to decrease scores on a variable, then the appropriate…
Q: Describe what does a non-statistical evaluation of the graphs of data for the two-factor experiment…
A: In design of experiment , "Factorial design" allows experiment to do study on many factors…
Q: turns out that the survey study at the U of M sampled students from a single student residence hall.…
A: Generally sampling should be done in such a way that the person who is doing sampling should be free…
Q: n a cohort study, the risk ratio of developing diabetes was close to 1 when comparing consumers of…
A:
Q: 4) Explain why outliers are weighted higher in the Variance equation WIR. n-1 (xi -x)2 Is this a…
A: Outliers are the data points that does not follow the common trend of the data. Data with many…
Q: For each of the following scenarios, what are two names for the ANOVA that would be conducted to…
A: Introduction: It is required to identify the type of ANOVA suitable for each scenario.
Q: A randomized experiment in Charlotte, North Carolina studied three police responses to spousal…
A:
Q: Some studies have suggested that a nightly glass of wine may not only take the edge off a day but…
A: (a) Step-by-step procedure to obtain scatter plot using Excel: Select the data of x and Select…
Q: Consider a study in which the sum of squares based on an experimental group of 10 participants is…
A: Pooled variance:The pooled variance is given by,
Q: A researcher has participants expecting to receive either painful or mild electrical shocks during a…
A: Usually in survival analysis studies we can use both parametric and non-parametric statistics. For…
Q: at a 0.10 significance level?
A: No treatment Fertilizer Irrigation Fertilizer and irrigation 1.212 0.939 0.069 0.852…
Q: Here is data for a 2-group study looking at levels of openness between successful and unsuccessful…
A: Given information: The data represents the values of sample size, mean and standard deviation of two…
Q: Consider the following research question, which will be answered using the data collected from the…
A:
Q: A researcher is comparing the occurrence of nausea as a side-effect in two brands of medication:…
A: n1 = Sample size of Brand A users = 150 X1 = sample of brand A users experienced nausea as a…
Q: (h) What is the value of the sample statistic?
A: p1 = 0.324 p2 = 0.182p-value = 0.002
Q: Can you tell me if my answer to this question on my homework assignment is correct and provide an…
A: Here A hypothesis test of a clinical trail has done comparing a new pain reliever for arthritis to a…
Q: A researcher is studying two types of medication that both treat hives. 15 out of the random sample…
A: Null and alternative hypothesis: Correct answer is option (3) The sample proportions are,
Q: for an experiment involving 3 levels of factor A and 3 levels of factor B with a sample of n=8 in…
A: The degrees of freedom values for the F-factor for A*B interaction is (4, 63) and it is obtained…
Q: In a sample of 81 elements, the mean was 60 and the variance was 144. What is the standard error for…
A:
Q: Consider a study in which the sum of squares (SS) based on an experimental group of 30 participants…
A: It is given that n1 is 30, n2 is 10, SS1 is 70 and SS2 is 50.
Q: In a study, researchers wanted to measure the effect of alcohol on the hippocampal region, the…
A: It is given that the sample mean is 8.01 and the sample standard deviation is 0.8.The population…
Q: An industrial/organizational psychologist has been consulting with a company that runs weekend…
A: Hey, since there are multiple questions posted, we will answer the first question. If you want any…
Q: If you have a Pearson correlation coefficient of .30, what is the proportion of variance accounted…
A:
Q: Consider a study in which the sum of squares (SS) based on an experimental group of 10 participants…
A: It is given that, The sum of squares (SS) based on an experimental group of 10 participants is 70.…
Q: In which of these research designs would you have complete control of the environment? Cohort…
A: Solution : In experimental design the researcher set up the environment and carefully controls the…
Q: In the original experiment, the average for the treatment group was 0.8 higher than the average for…
A: On observing the shape of the histogram, it is approximately bell-shaped and follows the normal…
Q: Problem in photo
A: Solution:The hypotheses are stated below:Null hypothesis:There is no association between alcohol…
Q: Please also explain why you determined whether or not the results are statistically significant.…
A: It is given that the mean scores for participants in Condition A and Condition B came out exactly…
Q: So far, Walter has scores of 18, 17, 19, and 21 points for the first four science quizzes. What does…
A: Walter scores of first four science quizzes is 18, 17, 19 and 21 points.
Q: What conclusions can be drawn from a study with a “statistical significance” result? What…
A: The result of a statistical test is said to be statistically significant, if the test statistic…
Q: A polling company reported that 59% of 1013 surveyed adults said that rising gas prices
A: (a). Find the expected value: The size of the sample taken from the population is n = 1013. It is…
Q: When comparing test scores of two groups, a difference of one point would never be highly…
A: In testing of hypothesis, the sample size doesn’t influence the result of the test.
Q: If a treatment is expected to decrease scores in a population with µ= 30, then the alternative…
A: If a treatment is expected to decrease scores in a population with µ= 30, then the alternative…


Trending now
This is a popular solution!

Step by step
Solved in 2 steps


- The mayor of a town has proposed a plan for the construction of an adjoining bridge. A political study took a sample of 900 voters in the town and found that 48% of the residents favored construction. Using the data, a political strategist wants to test the claim that the percentage of residents who favor construction is not equal to 51%. Testing at the 0.05 level, is there enough evidence to support the strategist's claim? Step 1 of 6 : State the null and alternative hypotheses.If the proportion of the population in City A that is over 65 years old is p1 and the proportion of the population in City B that is over 65 years old is p2, what is the null hypothesis for a test to determine if the proportion of the population that is over 65 years old is greater in City A?An organization published an article stating that in any one-year period, approximately 7.5 percent of adults in a country suffer from depression or a depressive illness. Suppose that in a survey of 100 people in a certain town, six of them suffered from depression or a depressive illness. Conduct a hypothesis test to determine if the true proportion of people in that town suffering from depression or a depressive illness is lower than the percent in the general adult population in the country. 1. Enter your answer to two decimal places. p' = 2. Calculate ?x. (Round your answer to three decimal places.) 3. Find the p-value. (Round your answer to four decimal places.)
- Two researchers are testing the null hypothesis that a population proportion p is equal to 0.30, and the alternative hypothesis that π = 0.30. Both take samples of 100 observations. Researcher A finds a sample proportion of 0.29, and Researcher B finds a sample proportion of 0.34. For which researcher will the p-value of the test be smaller? Explain without actually doing any computations.A certain university claims that for the last school year the proportion of students who were not able to earn a college diploma is at most 25%. The claim is found in the alternative hypothesis. Is this true or false? What is the null hypothesis?What is the alternative hypothesis?Only 26% of psychology majors are satisfied with their career paths as compared to 50% of accounting majors (The Wall Street Journal, October 11, 2010). Suppose these results were obtained from a survey of 300 psychology majors and 350 accounting majors.Let p1 represent the population proportion of satisfied accounting majors and p2 the population proportion of satisfied psychology majors. a. Develop the appropriate null and alternative hypotheses to test whether the proportion of accounting majors satisfied with their career paths differs from psychology majors by more than 20 percentage points. multiple choice 1 H0: p1 − p2 = 0.20; HA: p1 − p2 ≠ 0.20 H0: p1 − p2 ≤ 0.20; HA: p1 − p2 > 0.20 H0: p1 − p2 ≥ 0.20; HA: p1 − p2 < 0.20 b. Calculate the value of the test statistic. (Round intermediate calculations to at least 4 decimal places and final answer to 2 decimal places.) c. Find the p-value. multiple choice 2 p-value < 0.01 0.01 ≤…
- Are Republicans just as likely as Democrats to display the American flag in front of their residence on the Fourth of July? 441 of the 695 Republicans surveyed display the flag on the Fourth of July and 521 of the 751 Democrats surveyed display the flag on the Fourth of July. What can be concluded at the αα = 0.10 level of significance? For this study, we should use The null and alternative hypotheses would be: H0:H0: (please enter a decimal) H1:H1: (Please enter a decimal) The test statistic = (please show your answer to 3 decimal places.) The p-value = (Please show your answer to 4 decimal places.) The p-value is αα Based on this, we should the null hypothesis. Thus, the final conclusion is that ... The results are statistically significant at αα = 0.10, so there is sufficient evidence to conclude that the population proportion of Republicans who display the American flag in front of their residence on the Fourth of July…In a recent survey, it was stated that Americans watch television on average four hours per day. Assume that σ = 2. Using 40 students as the sample, conduct a hypothesis test to determine if the average for students at your school is lower:Previously, 11.2% of workers had a travel time to work of more than 60 minutes. An urban economist believes that the percentage has increased since then. She randomly selects 85 workers and finds that 11 of them have a travel time to work that is more than 60 minutes . Test the economist's belief at the a= 0.1 level of significance What are the null and alternative hypotheses? what are the null and alternative hypotheses? Because np0(1-p0)= < ? 10, Find the P-value.
- In a sample of 49 men, 38 said that they had less leisure time today than they had 10 years ago. In a sample of 49 women, 30 women said that they had less leisure time today than they had 10 years ago. At α=0.01, is there a difference in the proportions?Use p1 for the proportion of men with less leisure time. State the hypotheses and identify the claim with the correct hypothesis. H0 : p1=p2 ▼not claim H1 : p1≠p2 ▼claim This hypothesis test is a ▼two-tailed test. Find the critical value(s). Round the answer(s) to two decimal places. If there is more than one critical value, separate them with commas. Critical value(s):_______________Suppose a consumer group suspects that the proportion of households that have three or more cell phones is 0.37. A cell phone company has reason to believe that the proportion is not 0.37. Before they start a big advertising campaign, they conduct a hypothesis test. Their marketing people survey 103 households with the result that 82 of the households have three or more cell phones. What is the test statistics to test the Null hypothesis H0 : p = 0.37 against the alternative, Ha : p ≠ 0.37?The mayor of a town has proposed a plan for the construction of a new community. A political study took a sample of 1000 voters in the town and found that 39% of the residents favored construction. Using the data, a political strategist wants to test the claim that the percentage of residents who favor construction is more than 35%. Testing at the 0.02 level, is there enough evidence to support the strategist's claim? -State the null and alternative hypotheses?