You are conducting a study to see if the proportion of women over 40 who regularly have mamm significantly more than 83%. With H₁ p > 83% you obtain a test statistic of z = 3.108. Find th accurate to 4 decimal places. p-value =
You are conducting a study to see if the proportion of women over 40 who regularly have mamm significantly more than 83%. With H₁ p > 83% you obtain a test statistic of z = 3.108. Find th accurate to 4 decimal places. p-value =

Chapter4: Linear Functions
Section: Chapter Questions
Problem 30PT: For the following exercises, use Table 4 which shows the percent of unemployed persons 25 years or...

Related questions
Question
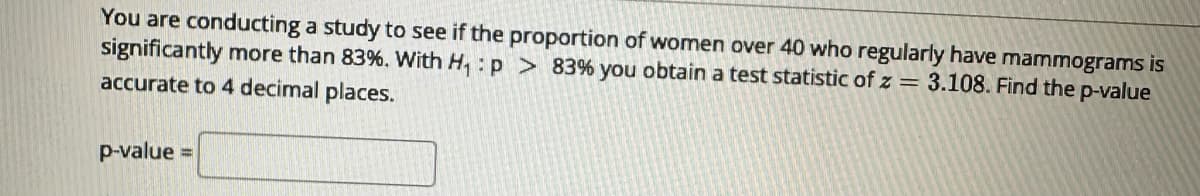
Transcribed Image Text:You are conducting a study to see if the proportion of women over 40 who regularly have mammograms is
significantly more than 83%. With H₁: p> 83% you obtain a test statistic of z = 3.108. Find the p-value
accurate to 4 decimal places.
p-value =
Expert Solution
This question has been solved!
Explore an expertly crafted, step-by-step solution for a thorough understanding of key concepts.

Step by step
Solved in 3 steps

Recommended textbooks for you

Trigonometry (MindTap Course List)
Trigonometry
ISBN:
9781337278461
Author:
Ron Larson
Publisher:
Cengage Learning

Trigonometry (MindTap Course List)
Trigonometry
ISBN:
9781337278461
Author:
Ron Larson
Publisher:
Cengage Learning

Functions and Change: A Modeling Approach to Coll…
Algebra
ISBN:
9781337111348
Author:
Bruce Crauder, Benny Evans, Alan Noell
Publisher:
Cengage Learning

Algebra & Trigonometry with Analytic Geometry
Algebra
ISBN:
9781133382119
Author:
Swokowski
Publisher:
Cengage

Glencoe Algebra 1, Student Edition, 9780079039897…
Algebra
ISBN:
9780079039897
Author:
Carter
Publisher:
McGraw Hill