You are testing the claim that the mean GPA of all the night students is different from the mean GPA of all the day students. A sample of 25 night students and 29 day students and their GPA's are recorded below. Test the claim using a 10% level of significance. It is reasonable to assume samples represent populations with normal distributions. Click this button to reveal the data. Click again to collapse it. GPA-Night 2.96 3.61 GPA-Day 3.47 3
You are testing the claim that the mean GPA of all the night students is different from the mean GPA of all the day students. A sample of 25 night students and 29 day students and their GPA's are recorded below. Test the claim using a 10% level of significance. It is reasonable to assume samples represent populations with normal distributions. Click this button to reveal the data. Click again to collapse it. GPA-Night 2.96 3.61 GPA-Day 3.47 3

Glencoe Algebra 1, Student Edition, 9780079039897, 0079039898, 2018
18th Edition
ISBN:9780079039897
Author:Carter
Publisher:Carter
Chapter10: Statistics
Section10.4: Distributions Of Data
Problem 19PFA

Related questions
Question
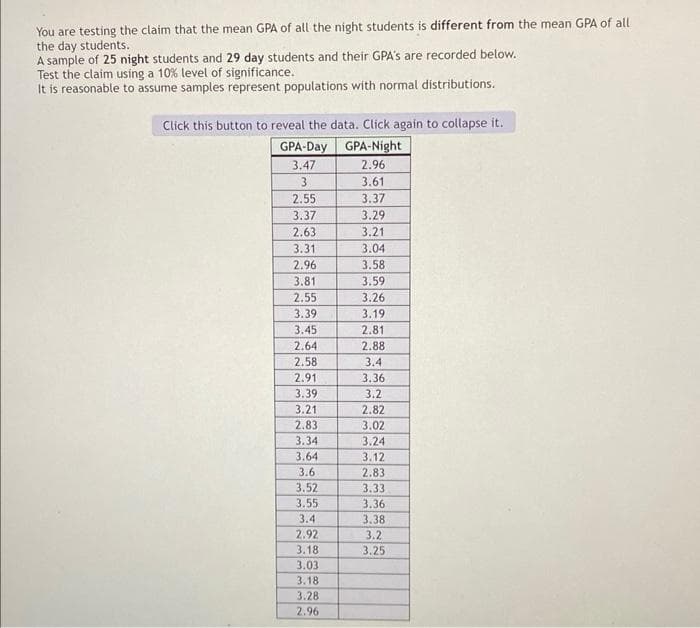
Transcribed Image Text:You are testing the claim that the mean GPA of all the night students is different from the mean GPA of all
the day students.
A sample of 25 night students and 29 day students and their GPA's are recorded below.
Test the claim using a 10% level of significance.
It is reasonable to assume samples represent populations with normal distributions.
Click this button to reveal the data. Click again to collapse it.
GPA-Night
2.96
3.61
3.37
3.29
3.21
3.04
GPA-Day
3.47
3
2.55
3.37
2.63
3.31
2.96
3.81
2.55
3.39
3.45
2.64
2.58
2.91
3.39
3.21
2.83
3.34
3.64
3.6
3.52
3.55
3.4
2.92
3.18
3.03
3.18
3.28
2.96
3.58
3.59
3.26
3.19
2.81
2.88
3.4
3.36
3.2
2.82
3.02
3.24
3.12
2.83
3.33
3.36
3.38
3.2
3.25
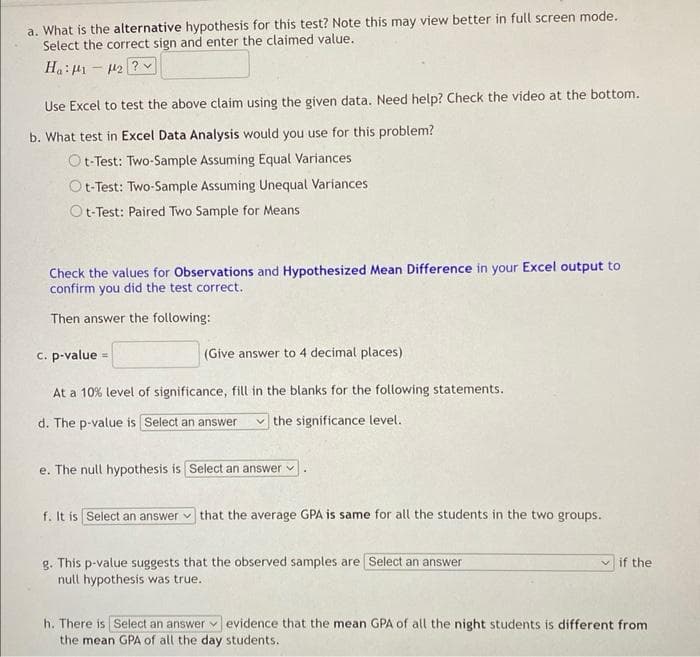
Transcribed Image Text:a. What is the alternative hypothesis for this test? Note this may view better in full screen mode.
Select the correct sign and enter the claimed value.
142?
Ha: 1
-
Use Excel to test the above claim using the given data. Need help? Check the video at the bottom.
b. What test in Excel Data Analysis would you use for this problem?
Ot-Test: Two-Sample Assuming Equal Variances
Ot-Test: Two-Sample Assuming Unequal Variances
Ot-Test: Paired Two Sample for Means
Check the values for Observations and Hypothesized Mean Difference in your Excel output to
confirm you did the test correct.
Then answer the following:
(Give answer to 4 decimal places)
At a 10% level of significance, fill in the blanks for the following statements.
d. The p-value is Select an answer the significance level.
c. p-value=
e. The null hypothesis is Select an answer
f. It is Select an answer that the average GPA is same for all the students in the two groups.
g. This p-value suggests that the observed samples are Select an answer
null hypothesis was true.
if the
h. There is Select an answer evidence that the mean GPA of all the night students is different from
the mean GPA of all the day students.
Expert Solution
This question has been solved!
Explore an expertly crafted, step-by-step solution for a thorough understanding of key concepts.

Step by step
Solved in 2 steps with 2 images

Recommended textbooks for you
Glencoe Algebra 1, Student Edition, 9780079039897…
Algebra
ISBN:
9780079039897
Author:
Carter
Publisher:
McGraw Hill
Glencoe Algebra 1, Student Edition, 9780079039897…
Algebra
ISBN:
9780079039897
Author:
Carter
Publisher:
McGraw Hill