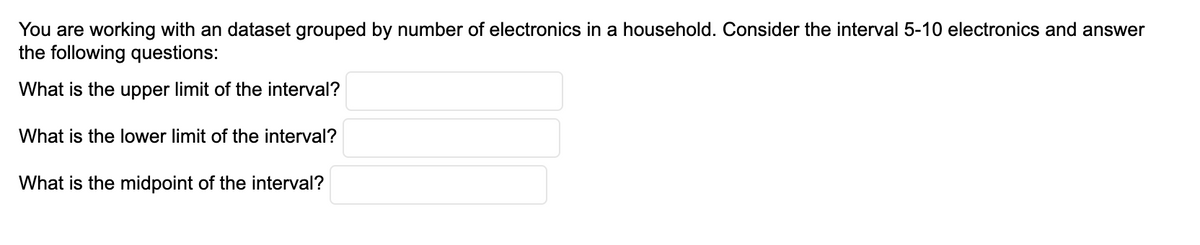
You are working with an dataset grouped by number of electronics in a household. Consider the interval 5-10 electronics and answer the following questions: What is the upper limit of the interval? What is the lower limit of the interval? What is the midpoint of the interval?


Q: What is the formula for calculating the Spearman's rank correlation coefficient, rho?
A: The formula for Spearman's rank correlation coefficient, denoted as ρ, is: ρ = 1 - 6∑d^2 / (n(n^2…
Q: Transaction accounts, which include checking, savings, and money market accounts, are the most…
A: The mean of the transaction account per household was $40200. The median value of the transaction…
Q: A researcher has fit a multiple regression model with four predictor variables, and the standard…
A: Introduction: Multiple regression is a statistical method that models the relationship between a…
Q: 3) The researchers want to know if female birds spend more time resting than male birds. There are…
A: t-test compares the means of two independent groups, in this case the mean resting time of male…
Q: An article in Soil Dynamics and Earthquake Engineering 2008, 28.10 evaluated the vulnerability of…
A: In this case, each highrise, unreinforced masonry building located in Zone-II has the only options…
Q: Construct potential hypotheses or research questions to relate the variables in each of the…
A: We have to define the potential hypotheses related to the given variables.
Q: In a Kruskal-Wallis test, what is the formula for calculating the test statistic H?
A: The formula for calculating the test statistic H in a Kruskal-Wallis test is given by: H =…
Q: Find the standard deviation of the data set. (Do not round until the final answer. Round final…
A: Given Data : Ages of Last 6 Presidents at InaugurationGeorge Bush 64Bill Clinton 46George W. Bush…
Q: Class Interval 0 to < 10 10 to 20 20 to 30 30 to 40 40 to 50 50 to 60 60 to < 70 Frequency 100000…
A: As per the Bartleby guildlines we have to solve first three subparts and rest can be reposted....…
Q: d) Plot the standard deviation on as a function of N. Does it follow the Central Limit Theorem?
A: Using R when a dice is thrown the fair dice fas the following values 1 2 3 4 5 6 For…
Q: Let X= [X₁, X₂, X₁' be a random vector with mean vector = [4, 3, 2]' and correlation matrix [16 4…
A:
Q: Which of the Set A: 12, 27, 9, 18, 12, 21 Set B: 9, 14, 8, 11, 9, 12 Set A following data sets has…
A: Solution: First we find means and standard deviations for both the data sets. x (x-x)2 12…
Q: 2.166 America's Melting Pot. The U.S. Census Bureau publishes data on the population of the United…
A: Given Information: Consider the given bar graph:
Q: An Olympic archer is able to hit the bull's-eye 86% of the time. Assume each shot is independent of…
A: Givenpercentage of olympic archer is able to hit the bull's-eye(p)=86%=0.86sample size(n)=9
Q: 9. Suppose that three runners from team A and three run- ners from team B participate in a race. If…
A: The question is about probability Given : Total no. of runners = 6 No. of runners in team A = 3 No.…
Q: Here's a game to consider. We throw a pair of dice. If the sum is 2, 11, or 12, you win. If the sum…
A: If we throw a pair of dice, then the sample space is S={(i, j): i=1, 2,.., 6; j=1, 2,..., 6}. The…
Q: The driver's reaction time in response to a particular potential traffic hazard is the time required…
A: Given data: 0.50, 0.49, 0.45, 0.54, 0.44, 0.49, 0.51, 0.48, 0.51, 0.53, 0.51, 0.63, 0.69, 0.76,…
Q: Is it possible to recover the raw data from this table? What is the total number of absenteeism…
A: It is given that the ungrouped data showing the number of students absent in a statistics class.…
Q: Consider the data set. 2,4,5,7,9 a) find the range b) use the defining formula to compute the sample…
A: We have given that, The data set are, X :- 2, 4, 5, 7, 9 Then, We will find the range, sample and…
Q: In an experiment, four different brands of fertilizer (A, B, C, and D) were tested on the growth of…
A: Introduction The Friedman Test is a non-parametric statistical test used to compare the…
Q: A researcher wants to determine if preschool attendance is associated with high school graduation…
A: Here we have to identify the correct response variable in this study
Q: A production supervisor at a major chemical company wishes to determine whether a new catalyst,…
A: Solution: Given information of pilot study is n= 5 Sample size s= 19.00 Sample standard deviation…
Q: Consider the stochastic matrices M₁ = *0*0 0* 0 * * 0 * 0 0* 0* M₂ = *0* 0 * 0 * *0*0 0*0* M3 = *0*…
A: Solution: From the given information, the stochastic matrices are
Q: What is the relationship between a person's height and their weight in a sample of 1000 individuals?
A: A linear regression analysis was performed on the data, which showed a strong positive correlation…
Q: A researcher wants to determine the average height of students in a university using convenience…
A: No, the researcher cannot use this sample to make inferences about the population of all students at…
Q: A study was done on the timeliness of flights categorized as either "on time" or "delayed" of two…
A: Given that The study is done on the timeliness of flights of two major airlines. The airlines are…
Q: You observe a sample of five numbers between 0 and 10. Their median is 5 and their mean is 5. What…
A: The numbers are between 0 to 10. The mean is the ratio of the sum of all observations to the total…
Q: a. Fill in the following frequency table using the data. Dividend Yield Frequency 2.5 to 3.0 3.0 to…
A: Answer:- Here, given data is
Q: How many cases are there? i How many variables are mentioned? i How many of the variables are…
A: The survey was conducted on 800 US smartphone users. The variable of interest are whether they had…
Q: 12. The cdf of a continuous random variable X is given by (0 x 1 Find the pdf and [Ans.: 0.195]
A: We have given that Cdf 0 , x<1 F(x)= x2 , 0<x<1 X…
Q: Calculate the mean, the median, and the standard deviation of Variable Q8 [How many hours per night…
A: Given that, the number of hours per night he/she sleeps (x). Sample size (n) = 55 To find the mean,…
Q: A researcher wants to test the difference in the mean scores of two independent groups on a…
A: To determine if there is a significant difference in the mean scores of the two groups, the…
Q: Tourism is extremely important to the economy of Florida. Hotel occupancy is an often-reported…
A: we have to formulate hypothesis testing. The proportion of rooms occupied in the current year (p1)…
Q: Listings for Female Realtors Mean Standard Error Median Mode Standard Deviation Sample Variance…
A: Given information: The data for female and male realtors is given.
Q: Suppose you roll a pair of six-sided dice and add their totals. The probabillity model is given…
A: Here given that The probabillity model is given below. Sum 2 3 4 5 6 7 8 9 10 11 12 Probabilty 1/36…
Q: What is the null hypothesis in the Wilcoxon Signed-Ranks Test?
A: Given information: Wilcoxon Signed-Ranks Test
Q: If X is a random variable with a mean of 20 and a standard deviation of 5, what is the probability…
A: From the provided information, Mean (µ) = 20 Standard deviation (σ) = 5
Q: QUESTION 6 Identify whether each of the following statements includes correct or incorrect use of…
A: a) Given that 23% of men said their identity had been stolen. The sum of the probability of all…
Q: Given two samples, A and B, with Pearson's correlation coefficient r = 0.7, and a significance level…
A: With a Pearson's correlation coefficient of 0.7 and a significance level of 0.05, we can reject the…
Q: A business bus travels 25 miles at 25mph, 25 miles at 50 mph, and 25 miles at 75mph. Calculate the…
A: GivenA business bus travels 25 miles at25 mph,50 mph,75 mphsample size(n)=3
Q: A real estate agency is interested in studying the relationship between the number of bedrooms in a…
A: Hi! Thank you for the question. As per the honor code, we are allowed to answer three sub-parts at a…
Q: (b) A random sample of 120 measurements taken from a normal population gave the following data:…
A: Solution:- From given information
Q: Mohammed has applied for positions at Company A and Company B. The probability of getting an offer…
A: Since you have posted multiple questions, we will provide the solution only to the first question as…
Q: The graph shows the percentage of high school seniors who used alcohol or marijuana during the 30…
A: The graph of the percentage of high school seniors who used alcohol or marijuana 30 days prior to…
Q: How do you determine if a strong positive or negative correlation exists between two variables using…
A: Correlation is a measure that indicates the strength and direction of association between two…
Q: Let Y be a random variable having characteristic function Find () EX] (1) E[X²] (m) Var[X] 0.8 1-0.2
A: Characteristics function of random variable X : Φx(t)=0.8/(1-0.2eit) To find 1): E(x) 2): E(x2) 3):…
Q: A researcher claims that the average time people spend commuting to work is more than 25 minutes. To…
A: To test the hypothesis, we can use a one-sample t-test. The null hypothesis is that the average time…
Q: An article in American Heart Journal ["Long-term survival after successful in-hospital cardiac…
A: The probability density function of X is f(x)=0.5e-0.5(x-3) for x>3.
Q: 1 3 w 2 In some board games, you move your marker a certain number of spaces based on the result of…
A: The notion of probability is a central concept in statistics. The classical definition of…
Q: From each of the two normally distributed populations, independent random samples were selected. n1…
A: Solution: Given Details: Sample1 - Sample size = n1 = 25 Sample mean = xbar1 = 35.4 Sample variance…

Step by step
Solved in 3 steps

- In each of the following variables, decide which type of data grouping (single-value, limit, or cutpoint) isprobably the best.4a. Number of Bedrooms. The number of bedrooms per single family dwellingb. Ages of Householders. The ages of householders, given as a whole numberc. Sleep Aids. The additional sleep, to the nearest tenth of an hour, obtained by a sample of 100 patientsby using a particular brand of sleeping pill.d. Number of Smartphones. The number of smartphones per person.e. Gas Mileage. The gas mileages, rounded to the nearest number of miles per gallon, of all new carmodels.f. Grammostola. The weight, in grams, of a sample of 50 Grammostola, a variety of tarantulasIf the class limits for a particular class in grouped data displaying the heights of group of medical students visiting the hospital is140cm – 150cm to the nearest cm, then the lower-class boundary is 139.5 cm 140 cm 140.5 cm 149.5 cm 150.5 cmIn each of the following variables, decide which type of data grouping (single-value, limit, or cutpoint) is probably the best.a. Number of Bedrooms. The number of bedrooms per single family dwellingb. Ages of Householders. The ages of householders, given as a whole numberc. Sleep Aids. The additional sleep, to the nearest tenth of an hour, obtained by a sample of 100 patients by using a particular brand of sleeping pill.d. Number of Smartphones. The number of smartphones per person.e. Gas Mileage. The gas mileages, rounded to the nearest number of miles per gallon, of all new car models.f. Grammostola. The weight, in grams, of a sample of 50 Grammostola, a variety of tarantulas.
- A quantitative Data set has been grouped by Using Limit grouping with equal width classes. The lower and upper Limits of the first class are three and eight, Respectively and The class width is six. What is the class mark of the second class?Which of the following best describes the process of finding the interquartile range for a set of data? a.Find the difference between the maximum and the minimum. b.Subtract Q1 from Q3. c.Add the biggest and smallest numbers. d.Place the numbers in order from least to greatest and find the middle.evaluate the limit .Question is attached below
- Here is a data set: 369 386 363 354 312 352 251 417 330 358 435 338 341 407 311 283 335 335 346 355 288 336 344 417 356 279 280 396 Construct a grouped frequency distribution table (GFDT) for this data set. You want 10 classes with a "nice" class width. Your classes should be labeled using interval notation. Each class contains its lower class limit, and the lower class limits should all be multiples of the class width. In that the data appears to be discrete, use a closed-interval to label each class. Hint: The first class is [240,259]. This is the format all classes should be entered. Data range FrequencyA quantitative data set has been grouped by using limit grouping with equal-width classes. The lower and upper limits of the first class are 3 and 8, respectively, and the class width is 6. a. What is the class mark of the second class?b. What are the lower and upper limits of the third class?c. Which class would contain an observation of 23?A sample of 10 cartons of Arrow water was taken to measure the degree of salts in the water and the results were shown as follows x = (6.5, 3.4, 7, 5.7, 6.1, 6.2, 7, 5.2, 3, 4.1) to show whether the production was under control using plates The arithmetic mean of the individual measures, find the maximum and the minimum *