You conduct a study to determine whether men and women have different colour preferences when buying a new car. In a questionnaire, you ask respondents to indicate their sex (male/female) and which of four possible colours they would choose when buying a new car. The table below shows the frequencies you observed: Male Female Total White 11 22 33 Male Female Total Blue 16 White 17.43 15.57 33.00 6 22 Red 10 12 22 The expected frequencies under the null hypothesis that there are no differences between men and women in colour preference are as follows: Blue 11.62 10.38 22.00 Green 19 10 29 Red 11.62 10.38 22.00 Total 56 50 106 Green 15.32 13.68 29.00 Total 56.00 50.00 106.00 Based on the information given in these tables, calculate the chi-square statistic. (Provide your answer as a number rounded to two decimal places, e.g. 6.83).
You conduct a study to determine whether men and women have different colour preferences when buying a new car. In a questionnaire, you ask respondents to indicate their sex (male/female) and which of four possible colours they would choose when buying a new car. The table below shows the frequencies you observed: Male Female Total White 11 22 33 Male Female Total Blue 16 White 17.43 15.57 33.00 6 22 Red 10 12 22 The expected frequencies under the null hypothesis that there are no differences between men and women in colour preference are as follows: Blue 11.62 10.38 22.00 Green 19 10 29 Red 11.62 10.38 22.00 Total 56 50 106 Green 15.32 13.68 29.00 Total 56.00 50.00 106.00 Based on the information given in these tables, calculate the chi-square statistic. (Provide your answer as a number rounded to two decimal places, e.g. 6.83).

Glencoe Algebra 1, Student Edition, 9780079039897, 0079039898, 2018
18th Edition
ISBN:9780079039897
Author:Carter
Publisher:Carter
Chapter10: Statistics
Section10.6: Summarizing Categorical Data
Problem 10CYU

Related questions
Question
The answer is 10,88.
How can I get there, using what formulas and calculations?
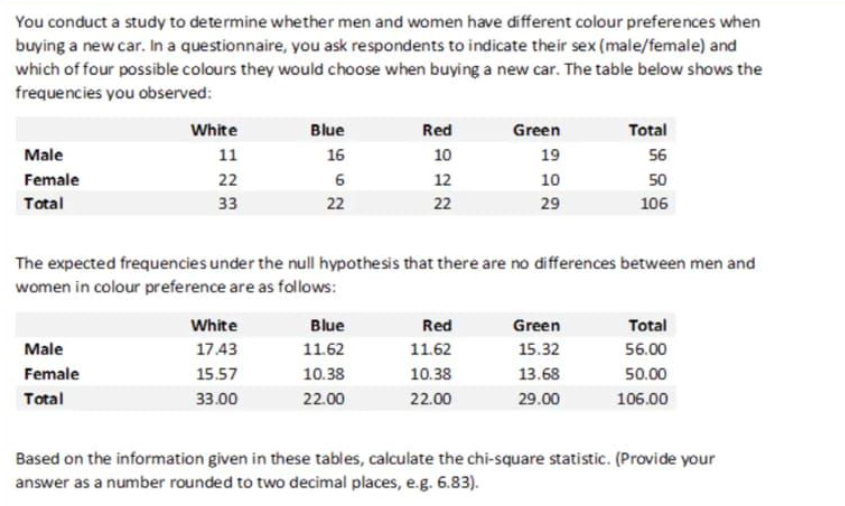
Transcribed Image Text:You conduct a study to determine whether men and women have different colour preferences when
buying a new car. In a questionnaire, you ask respondents to indicate their sex (male/female) and
which of four possible colours they would choose when buying a new car. The table below shows the
frequencies you observed:
Male
Female
Total
White
11
22
33
Male
Female
Total
White
17.43
Blue
16
6
22
15.57
33.00
The expected frequencies under the null hypothesis that there are no differences between men and
women in colour preference are as follows:
Red
10
12
22
Blue
11.62
10.38
22.00
Green
19
10
29
Red
11.62
10.38
22.00
Green
15.32
Total
56
50
106
13.68
29.00
Total
56.00
50.00
106.00
Based on the information given in these tables, calculate the chi-square statistic. (Provide your
answer as a number rounded to two decimal places, e.g. 6.83).
Expert Solution
This question has been solved!
Explore an expertly crafted, step-by-step solution for a thorough understanding of key concepts.

Step by step
Solved in 2 steps with 3 images

Recommended textbooks for you
Glencoe Algebra 1, Student Edition, 9780079039897…
Algebra
ISBN:
9780079039897
Author:
Carter
Publisher:
McGraw Hill

Big Ideas Math A Bridge To Success Algebra 1: Stu…
Algebra
ISBN:
9781680331141
Author:
HOUGHTON MIFFLIN HARCOURT
Publisher:
Houghton Mifflin Harcourt

Holt Mcdougal Larson Pre-algebra: Student Edition…
Algebra
ISBN:
9780547587776
Author:
HOLT MCDOUGAL
Publisher:
HOLT MCDOUGAL
Glencoe Algebra 1, Student Edition, 9780079039897…
Algebra
ISBN:
9780079039897
Author:
Carter
Publisher:
McGraw Hill
Big Ideas Math A Bridge To Success Algebra 1: Stu…
Algebra
ISBN:
9781680331141
Author:
HOUGHTON MIFFLIN HARCOURT
Publisher:
Houghton Mifflin Harcourt
Holt Mcdougal Larson Pre-algebra: Student Edition…
Algebra
ISBN:
9780547587776
Author:
HOLT MCDOUGAL
Publisher:
HOLT MCDOUGAL