You conduct a study to understand whether happy people are more likely to exercise than sad people. In your sample of happy people. 25 chose to exercise and 10 chose to take a nap. In your sample of sad people, 5 chose to exercise and 35 chose to take a nap. (1) What is the null hypothesis? a. There is a difference in rates of exercise among happy and sad people. b. There is an association in rates of exercise among happy and sad people. c. There is not a difference in rates of exercise among happy and sad people. d. There is not an association in rates of happiness among those who exercise and those who nap. (2) What is the expected frequency for happy people who exercise? (3) What is the expected frequency for sad people who exercise? 4) What is the expected frequency for happy people who nap? 5) What ie tho oxpootod t
You conduct a study to understand whether happy people are more likely to exercise than sad people. In your sample of happy people. 25 chose to exercise and 10 chose to take a nap. In your sample of sad people, 5 chose to exercise and 35 chose to take a nap. (1) What is the null hypothesis? a. There is a difference in rates of exercise among happy and sad people. b. There is an association in rates of exercise among happy and sad people. c. There is not a difference in rates of exercise among happy and sad people. d. There is not an association in rates of happiness among those who exercise and those who nap. (2) What is the expected frequency for happy people who exercise? (3) What is the expected frequency for sad people who exercise? 4) What is the expected frequency for happy people who nap? 5) What ie tho oxpootod t

Holt Mcdougal Larson Pre-algebra: Student Edition 2012
1st Edition
ISBN:9780547587776
Author:HOLT MCDOUGAL
Publisher:HOLT MCDOUGAL
Chapter11: Data Analysis And Probability
Section: Chapter Questions
Problem 8CR

Related questions

Concept explainers
Contingency Table
A contingency table can be defined as the visual representation of the relationship between two or more categorical variables that can be evaluated and registered. It is a categorical version of the scatterplot, which is used to investigate the linear relationship between two variables. A contingency table is indeed a type of frequency distribution table that displays two variables at the same time.
Binomial Distribution
Binomial is an algebraic expression of the sum or the difference of two terms. Before knowing about binomial distribution, we must know about the binomial theorem.
Topic Video
Question
Transcribed Image Text:QUESTION 2
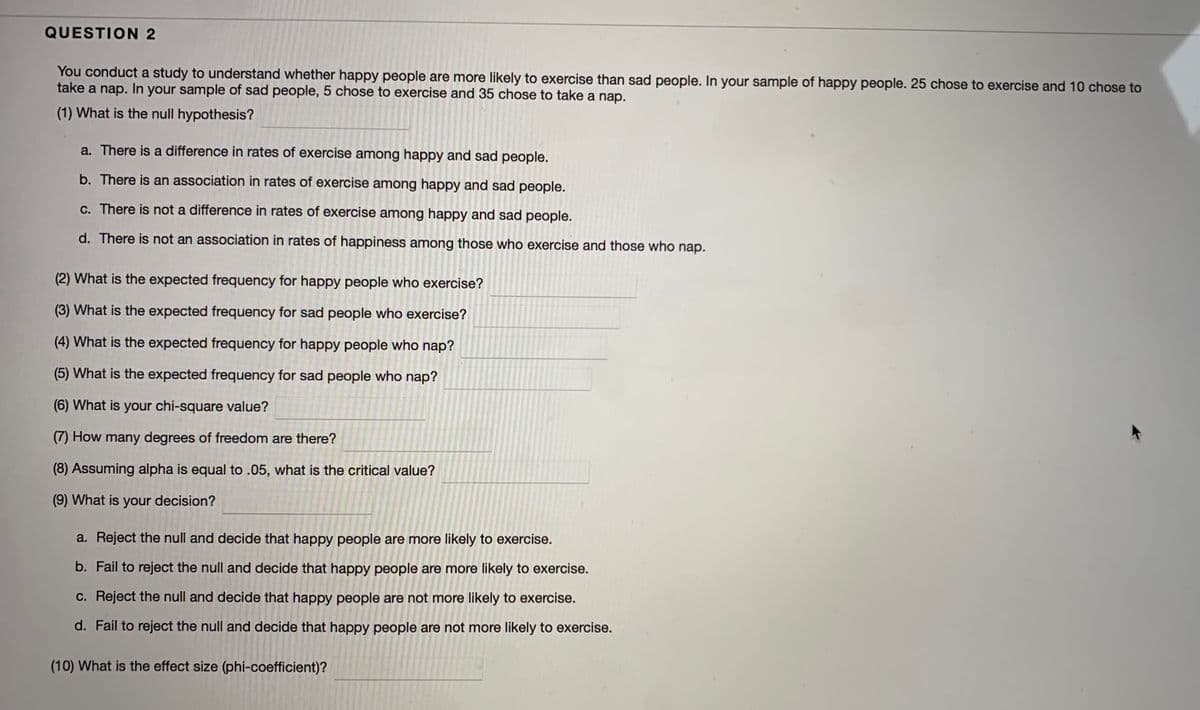
You conduct a study to understand whether happy people are more likely to exercise than sad people. In your sample of happy people. 25 chose to exercise and 10 chose to
take a nap. In your sample of sad people, 5 chose to exercise and 35 chose to take a nap.
(1) What is the null hypothesis?
a. There is a difference in rates of exercise among happy and sad people.
b. There is an association in rates of exercise among happy and sad people.
c. There is not a difference in rates of exercise among happy and sad people.
d. There is not an association in rates of happiness among those who exercise and those who nap.
(2) What is the expected frequency for happy people who exercise?
(3) What is the expected frequency for sad people who exercise?
(4) What is the expected frequency for happy people who nap?
(5) What is the expected frequency for sad people who nap?
(6) What is your chi-square value?
(7) How many degrees of freedom are there?
(8) Assuming alpha is equal to .05, what is the critical value?
(9) What is your decision?
a. Reject the null and decide that happy people are more likely to exercise.
b. Fail to reject the null and decide that happy people are more likely to exercise.
c. Reject the null and decide that happy people are not more likely to exercise.
d. Fail to reject the null and decide that happy people are not more likely to exercise.
(10) What is the effect size (phi-coefficient)?
Expert Solution
This question has been solved!
Explore an expertly crafted, step-by-step solution for a thorough understanding of key concepts.

This is a popular solution!

Trending now
This is a popular solution!

Step by step
Solved in 2 steps

Knowledge Booster


Learn more about
Need a deep-dive on the concept behind this application? Look no further. Learn more about this topic, statistics and related others by exploring similar questions and additional content below.Recommended textbooks for you
Holt Mcdougal Larson Pre-algebra: Student Edition…
Algebra
ISBN:
9780547587776
Author:
HOLT MCDOUGAL
Publisher:
HOLT MCDOUGAL

Holt Mcdougal Larson Pre-algebra: Student Edition…
Algebra
ISBN:
9780547587776
Author:
HOLT MCDOUGAL
Publisher:
HOLT MCDOUGAL