You could use your knowledge of profit and MS Excel to indicate when the local mask provider will achieve a profit of around £10.000. You could assume linearity or non-linearity when calculating profit."
Q: The population of a rare species of flightless birds in 2005 was estimated to be 198,192 birds. By…
A: We have given the population of birds different years i.e. in 2005 the population is 198192 or…
Q: A company produces a special new type of TV. The company has fixed costs of $452,000, and it costs…
A: Let's find.
Q: You have been hired as a marketing consultant to Johannesburg Burger Supply, Inc., and you wish to…
A: (a) It is given that, the price is set at $2 per burger the sales amount to $5000 per week, but when…
Q: y 38 137 56 201 50 152 52 107 37 150 60 173 67 194 54 166 59 154 43 137 30 38 53 193 59 154 40 175…
A: The given data Using Regression analysis in Excel Data --> Data Analysis --> Regression
Q: The wholesale price for chicken in the United States fell from 25¢ per pound to 14¢ per pound, while…
A: The wholesale price for chicken in the United States fell from 25¢ per pound to 14¢ per pound, while…
Q: Two years ago your orange orchard contained 70 trees, and the yield per tree was 70 bags of oranges.…
A: Two years ago your orange orchard contained 70 trees, and the yield per tree was 70 bags of oranges.…
Q: At a price of $4.78 per pound, the supply for cherries is 16,218 pounds, and the demand is 10,268…
A: Given problem:- At a price of $4.78 per pound, the supply for cherries is 16,218 pounds, and the…
Q: Consider yourself as an entrepreneur at the Mall selling 6000 donuts a day at 50c each. When you…
A:
Q: A company produces a special new type of TV. The company has fixed costs of $480,000, and it costs…
A:
Q: The supply and demand for a product are given by 2p - q = 50 pq = 100 +20q, respectively. Find the…
A:
Q: At a peach packaging plant, 48,000 lbs of fresh peaches are processed and packed each hour. The…
A: (a) Obtain the Linear model for the given data as follows.
Q: A linear regression of age (x) on blood lead levels (y) for men who have worked in factories that…
A:
Q: The population of an endangered species of rhinos in 2002 was estimated to be 192,699 rhinos. By…
A:
Q: A plant can manufacture 40 tennis racket per day for a total daily cost of $3,500 and 22 tennis…
A: Given: A plant can manufacture 40 tennis racket per day for a total daily cost of $3,500 and 22…
Q: The phone company, Ringular, has a monthly cellular plan where the customer pays a flat monthly fee…
A:
Q: In the equation of a linear regression, Y = b;X + bo, if b, = -6.2 which means %3D !! a. For each…
A: Given regression equation Y=b1X + b0 and if b1=-6.2
Q: ) ii and iii only
A: Dependent variables - A variable whose value depends on another variable . Independent variables - A…
Q: 1. In economics, the demand for a product is the amount of that product that consumers are willing…
A: x=number of quantities y=price when the price is $3 then the demanded quantities are 500 units…
Q: 4) State whether a quadratic model or a linear model would be the better fit for this data.…
A: Given the given table is
Q: 3. A city parking garage charges a flat rate of $4.00 for parking 2 hours or less, and $0.50 per…
A: Let the person parks for an additional x hours and the total charge paid by the person is y.
Q: 2) According to the U.S. Department of Education, the average financial aid award (in dollars) for a…
A: Given: Year Amount 2000 2925 2005 3407 2009 4056 2011 4341
Q: A company finds that it can sell 120 items at a price of $490 each and sell 440 items at a price of…
A:
Q: If the slope of a linear model is zero, what is the appropriate conclusion?
A: Given that The slope of a linear model is zero. We know that If there is significant linear…
Q: Stutz Department Store will buy 10 pairs of sunglasses if the price is $89 per pair and 30 pairs if…
A: In this question, we need to find the market equilibrium point.
Q: In 1995 town A had 500,000 people but this number had decreased to 425,000 by 2005. Town B had…
A: Given The population of town A In 1995 - 500,000 in 2005 - 425,000 The population of town…
Q: The quantity demanded x (in units of a hundred) of the Mikado miniature cameras per week is related…
A:
Q: The population of a rare species of flightless birds in 2005 was estimated to be 198,192 birds. By…
A:
Q: A game console manufacturer determines that in order to sell x units, the price per one unit (in…
A: The price per one unit (in dollars) is Total revenue function is Total cost function is The…
Q: Retailers will buy 45 Wi-Fi routers from a wholesaler if the price is $10 each but only 20 if the…
A: We have to find the equilibrium point at which both the supply and demand functions met.
Q: In June 2001 the retail price of a 25-kilogram bag of cornmeal was $8 in Zambia; by December the…
A: Let x be the price in dollars and y be the number of bags per day. Here, the retail price of a…
Q: Two years ago your orange orchard contained 90 trees, and the yield per tree was 65 bags of oranges.…
A: Given, Two years ago your orange orchard contained 90 trees, and the yield per tree was 65 bags of…
Q: In June 2001 the retail price of a 25-kilogram bag of cornmeal was $8 in Zambia; by December the…
A: Consider the given statement. Formula used: The equation of the line passing through two points…
Q: Given the following linear equation between salary in (in hundreds of dollars ) and years of…
A:
Q: A pharmaceutical salesperson receives a monthly salary of $2600 plus a commission of 2% of sales.…
A: Note : As per our guidelines we are supposed to answer only one question. Since you have asked…
Q: A group of retailers will buy 80 televisions from a wholesaler if the price is $350 and 120 if the…
A: First we will solve for demand : If price is $350 they will buy 80 televisions. If price is $300…
Q: At a price of $4.72 per pound, the supply for cherries is 16,352 pounds, and the demand is 10,240…
A:
Q: Your college newspaper, The Collegiate Times, has fixed production costs of $7000 per edition, and…
A:
Q: The supply and demand equations for a particular product are p= 80 + 0.18q andp=…
A:
Q: The population of an endangered species of rhinos in 2002 was estimated to be 192,699 rhinos. By…
A: Use slope formula for evaluating the variable
Q: According to a sleep foundation, in 2011 a certain nation averaged 6.3 hours of sleep each…
A:
Q: Both of the following HVAC companies charge a service call fee and an hourly rate, for residential…
A: Given query is to find the linear modal or service cost in terms of x.
Q: A tour guide charges a price of $600 per person for a jungle tour and typically 8 persons sign up…
A:
Q: Given the following linear equation between salary in (in hundreds of dollars) and years of…
A: The given linear equation between salary in (in hundreds of dollars) and years of experience is,…
Q: The population of an endangered species of rhinos in 2002 was estimated to be 148,003 rhinos. By…
A: Given, The population of an endangered species of rhinos in 2002 was estimated to be 148,003 rhinos…
Q: A study investigating the relationship between a country's annual gross domestic product x (in…
A: From the given information we find the correct Option.
Q: In the equation of a linear regression, Y = b;X + bo, if b, = -6.2 which means %3D O a. For each…
A: Given regression equation Y=b1X+b0 ,
Q: The table below contains the average public school classroom teacher's salaries, yy, for an 11-year…
A: In this case Year (x) is the independent variable and Salary (y) is the dependent variable.
Q: The population of a city in 2002 was 143,477 people. By 2013, the population of the city had grown…
A: Solved below
Q: The population of a rare species of flightless birds in 2004 was estimated to be 152,670 birds. By…
A:
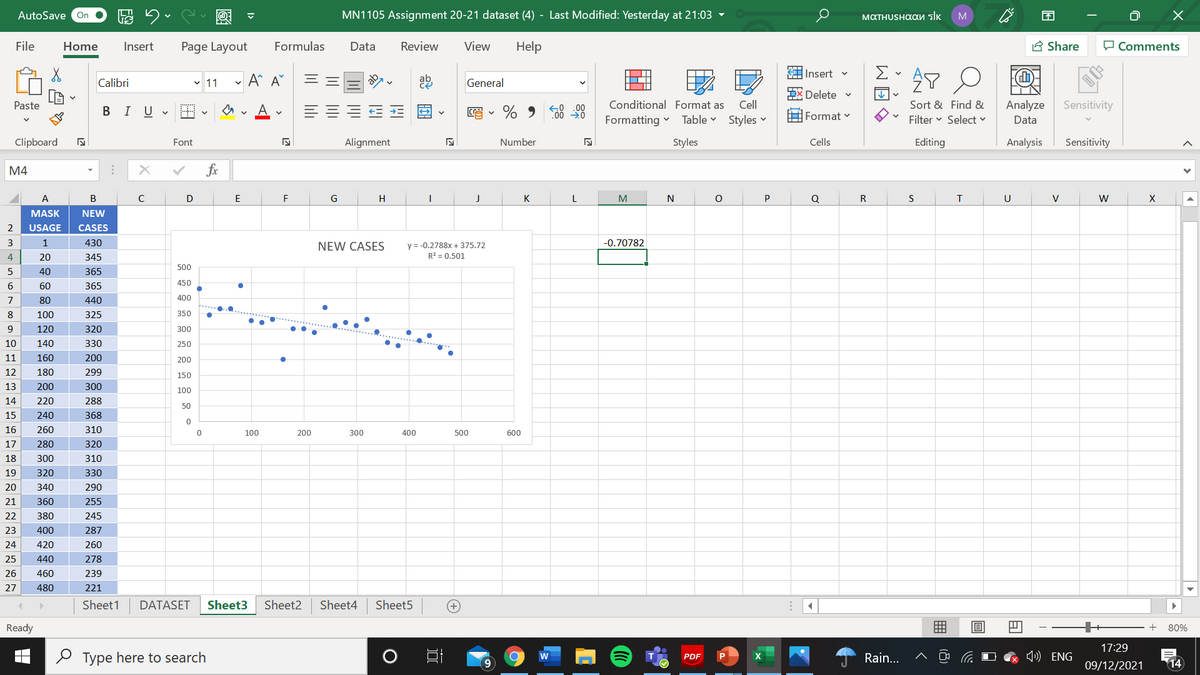
"You could use your knowledge of profit and MS Excel to indicate when the local mask provider will achieve a profit of around £10.000. You could assume linearity or non-linearity when calculating profit."
Trending now
This is a popular solution!
Step by step
Solved in 2 steps
- Seedlings of understory trees in mature tropical rainforests must survive and grow using intermittent flecks of sunlight. How does the length of exposure to these flecks of sunlight (fleck duration) affect growth? Researchers experimentally irradiated seedlings of the Southeast Asian rainforest tree with flecks of light of varying duration while maintaining the same total irradiance to all the seedlings. Below is the data. Fit a linear model to the data. Tree Mean Fleck (min) Relative growth rate (mm/mm/week 1 3.4 0.013 2 3.2 0.008 3 3 0.007 4 2.7 0.005 5 2.8 0.003 6 3.2 0.003 7 2.2 0.005 8 2.2 0.003 9 2.4 0 10 4.4 0.009 11 5.1 0.01 12 6.3 0.009 13 7.3 0.009 14 6 0.016 15 5.9 0.025 16 7.1 0.021 17 8.8 0.024 18 7.4 0.019 19 7.5 0.016 20 7.5 0.014 21 7.9 0.014 a)What is the rate of change in relative growth…The file MidCity Download MidCitycontains data on 128 recent sales in Mid City. For each sale, the file shows the neighborhood (1, 2, or 3) in which the house is located, the number of offers made on the house, the square footage, whether the house is made primarily of brick, the number of bathrooms, the number of bedrooms, and the selling price. Neighborhoods 1 and 2 are more traditional neighborhoods, whereas neighborhood 3 is a newer, more prestigious neighborhood. Conduct a regression analysis to understand, estimate and interpret the square footage of houses in Mid City. Use one Excel spreadsheet labeled P2 to show your work for this problem. Home Nbhd Offers Sq Ft Brick Bedrooms Bathrooms Price 1 2 2 1790 No 2 2 228600 2 2 3 2030 No 4 2 228400 3 2 1 1740 No 3 2 229600 4 2 3 1980 No 3 2 189400 5 2 3 2130 No 3 3 239600 6 1 2 1780 No 3 2 229200 7 3 3 1830 Yes 3 3 303200 8 3 2 2160 No 4 2 301400 9 2 3 2110 No 4 2 238400 10 2 3 1730 No 3 3 208000 11 2 3 2030…Which graph used in a residual analysis provides roughly the same information as a scatterplot? What advantages does it have over a scatterplot?
- The graph shows a bivariate data set and its least squares regression line. Draw the residual plot for the same data set?Consider a linear regression model that relates school expenditures and family background to student performance in Massachusetts using 224 school districts. The response variable is the mean score on the MCAS (Massachusetts Comprehensive Assessment System) exam given in May 1998 to 10th-graders. Four explanatory variables are used: (1) STR is the student-to-teacher ratio, (2) TSAL is the average teacher’s salary, (3) INC is the median household income, and (4) SGL is the percentage of single family households. The Excel Regression output for the sample regression equation is given below. (a) What proportion of the variation in MCAS score is explained by the explanatory variables? (b) At the 5% level, are the explanatory variables jointly significant in explaining MCAS score? Explain briefly. (c) At the 5% level, which variables are individually significant at predicting MCAS score? Explain briefly. (d) Suppose a second regression model (Model 2) was generated using only…Consider a linear regression model that relates school expenditures and family background to student performance in Massachusetts using 224 school districts. The response variable is the mean score on the MCAS (Massachusetts Comprehensive Assessment System) exam given in May 1998 to 10th-graders. Four explanatory variables are used: (1) STR is the student-to-teacher ratio, (2) TSAL is the average teacher’s salary, (3) INC is the median household income, and (4) SGL is the percentage of single family households. The Excel Regression output for the sample regression equation is given below. (a) What proportion of the variation in MCAS score is explained by the explanatory variables? (b) At the 5% level, are the explanatory variables jointly significant in explaining MCAS score? Explain briefly. (c) At the 5% level, which variables are individually significant at predicting MCAS score? Explain briefly. (d) Suppose a second regression model (Model 2) was generated using only…
- Managers of an outdoor coffee stand in Coast City are examining the relationship between (hot) coffee sales and daily temperature, hoping to be able to predict a day's total coffee sales from the maximum temperature that day. The bivariate data values for the coffee sales (denoted by y, in dollars) and the maximum temperature (denoted by x, in degrees Fahrenheit) for each of randomly selected days during the past year are given below. These data are plotted in the scatter plot below. (a)For these data, temperature values that are less than the mean of the temperature values tend to be paired with coffee sales values that are ▼(Choose one) the mean of the coffee sales values. (b)According to the regression equation, for an increase of one degree in temperature, there is a corresponding ▼(Choose one) of 9.94 dollars in coffee sales. (c)From the regression equation, what is the predicted coffee sales value (in dollars) when the temperature is 74.6 degrees Fahrenheit? (Round your…Exercise 14.27 To identify high-paying jobs for people that do not like stress, the following data were collected showing the average annual salary ($1000) and the stress tolerance for a variety of occupations (Business Insider, November 8, 2013). The stress tolerance for each job is rated on a scale from 0 to 100, where a lower rating indicates less stress. Click on the datafile logo to reference the data. a. Select a scatter diagram for these data with average annual salary as the independent variable. - Select your answer -Scatter diagram 1Scatter diagram 2Scatter diagram 3Item 1 What does the scatter diagram indicate about the relationship between the two variables?- Select your answer -Positive linear relationshipNegative linear relationshipItem 2 b. Use these data to develop an estimated regression equation that can be used to predict stress tolerance given the average annual salary. Round your answers to four decimal places. = - x c. At the .05 level of…At Hard Rock’s Moscow restaurant, the manager is trying to evaluate how a new advertising campaign affects guest counts. Using data for the past 10 months (see the table), develop a least-squares regression relationship and then forecast the expected guest count when advertising is $65,000.
- Calculate the residual for the first observation in the dataset.#Original immigrant datax = c(61159, 57524,56186,52254,54884,51869,29743,39877,50086,53672,65707,73861) #Age of labor dataage_over_16 = x*0.95 #Illegal immigrant data of employede1 = age_over_16*0.65 #Illegal immigrant data of unemployede2 = age_over_16*0.04 #Illegal immigrant data of Not in the labor forcee3 = age_over_16*0.30 What linear regression model should I use in R? And how to draw the linear regression graph based on this model? Thanks.#Original immigrant datax = c(61159, 57524,56186,52254,54884,51869,29743,39877,50086,53672,65707,73861) #Age of labor dataage_over_16 = x*0.95 #Illegal immigrant data of employede1 = age_over_16*0.65 #Illegal immigrant data of unemployede2 = age_over_16*0.04 #Illegal immigrant data of Not in the labor forcee3 = age_over_16*0.30 What linear regression model should I use in R? Thanks.