You have consistently exceeded your regular output of 30 shipments per week and wonder if that may have something to do with the number of defects. Develop a scatter diagram using total number of shipments and number of defective shipments. Does there appear to be a relationship?
You have consistently exceeded your regular output of 30 shipments per week and wonder if that may have something to do with the number of defects. Develop a scatter diagram using total number of shipments and number of defective shipments. Does there appear to be a relationship?

Practical Management Science
6th Edition
ISBN:9781337406659
Author:WINSTON, Wayne L.
Publisher:WINSTON, Wayne L.
Chapter2: Introduction To Spreadsheet Modeling
Section: Chapter Questions
Problem 20P: Julie James is opening a lemonade stand. She believes the fixed cost per week of running the stand...

Related questions
Question
Transcribed Image Text:ca/d21/le/content/775993/viewContent/6496162/View
YouTube
W Maps
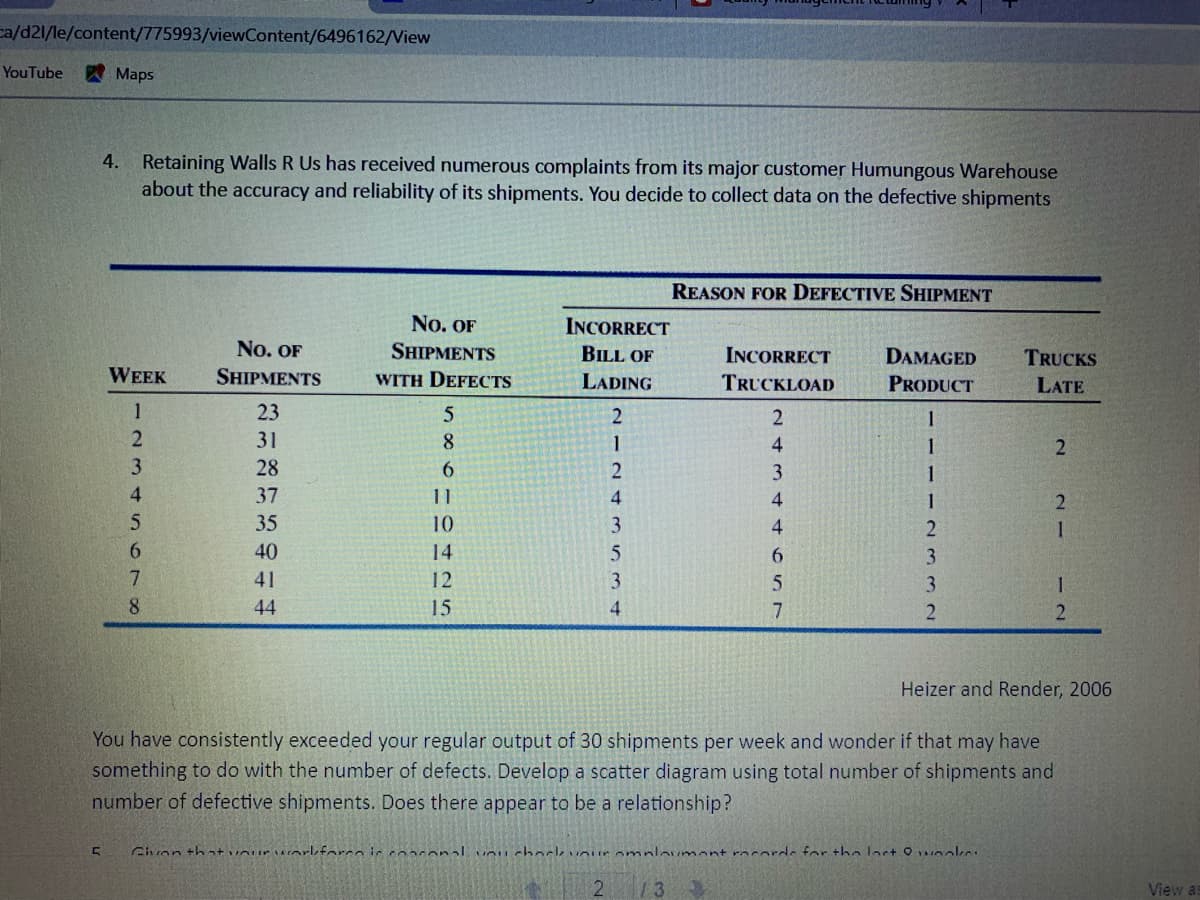
4. Retaining Walls R Us has received numerous complaints from its major customer Humungous Warehouse
about the accuracy and reliability of its shipments. You decide to collect data on the defective shipments
REASON FOR DEFECTIVE SHIPMENT
No. OF
INCORRECT
No. OF
SHIPMENTS
BILL OF
INCORRECT
DAMAGED
TRUCKS
WEEK
SHIPMENTS
WITH DEFECTS
LADING
TRUCKLOAD
PRODUCT
LATE
1
23
31
8.
1
4.
1
3
28
6
3
1
4
37
11
4.
4
35
10
4
1.
6.
40
14
6.
3.
7.
41
12
3
1
8.
44
15
Heizer and Render, 2006
You have consistently exceeded your regular output of 30 shipments per week and wonder if that may have
something to do with the number of defects. Develop a scatter diagram using total number of shipments and
number of defective shipments. Does there appear to be a relationship?
Civon thatunurwnrlıforco isc onal unu choclvour omnloumont rocorde for the last O vinolke
2.
13
View as
Expert Solution
This question has been solved!
Explore an expertly crafted, step-by-step solution for a thorough understanding of key concepts.

This is a popular solution!

Trending now
This is a popular solution!

Step by step
Solved in 3 steps with 1 images

Recommended textbooks for you
Practical Management Science
Operations Management
ISBN:
9781337406659
Author:
WINSTON, Wayne L.
Publisher:
Cengage,

Operations Management
Operations Management
ISBN:
9781259667473
Author:
William J Stevenson
Publisher:
McGraw-Hill Education

Operations and Supply Chain Management (Mcgraw-hi…
Operations Management
ISBN:
9781259666100
Author:
F. Robert Jacobs, Richard B Chase
Publisher:
McGraw-Hill Education
Practical Management Science
Operations Management
ISBN:
9781337406659
Author:
WINSTON, Wayne L.
Publisher:
Cengage,
Operations Management
Operations Management
ISBN:
9781259667473
Author:
William J Stevenson
Publisher:
McGraw-Hill Education
Operations and Supply Chain Management (Mcgraw-hi…
Operations Management
ISBN:
9781259666100
Author:
F. Robert Jacobs, Richard B Chase
Publisher:
McGraw-Hill Education


Purchasing and Supply Chain Management
Operations Management
ISBN:
9781285869681
Author:
Robert M. Monczka, Robert B. Handfield, Larry C. Giunipero, James L. Patterson
Publisher:
Cengage Learning

Production and Operations Analysis, Seventh Editi…
Operations Management
ISBN:
9781478623069
Author:
Steven Nahmias, Tava Lennon Olsen
Publisher:
Waveland Press, Inc.