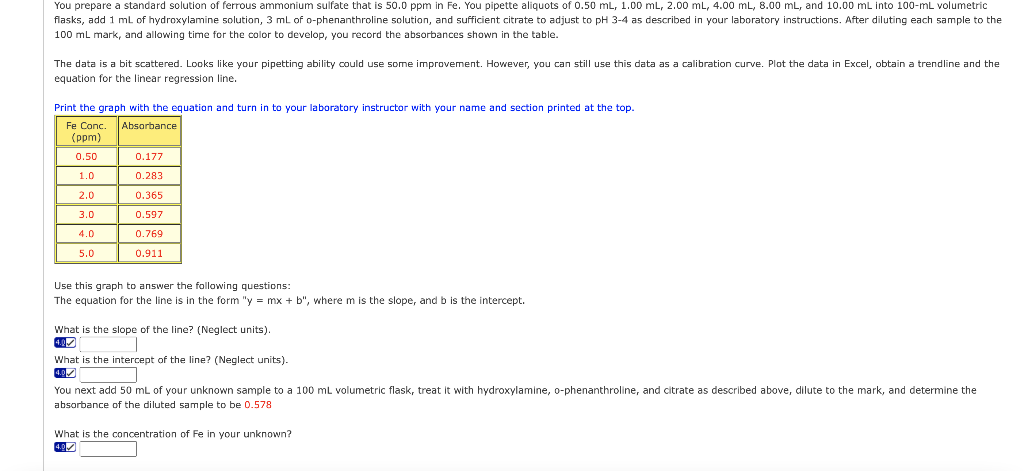
You prepare a standard solution of ferrous ammonium sulfate that is 50.0 ppm in Fe. You pipette aliquots of 0.50 mL, 1.00 mL, 2.00 mL, 4.00 mL, 8.00 mL, and 10.00 mL into 100-mL volumetric flasks, add 1 mL of hydroxylamine solution, 3 mL of o-phenanthroline solution, and sufficient citrate to adjust to pH 3-4 as described in your laboratory instructions. After diluting each sample to the 100 mL mark, and allowing time for the color to develop, you record the absorbances shown the table. The data is a bit scattered. Looks like your pipetting ability could use some improvement. However, you can still use this data as a calibration curve. Plot the data in Excel, obtain a trendline and the equation for the linear regression line. Print the graph with the equation and turn to your laboratory instructor with your name and section printed at the top. Fe Conc. Absorbance (ppm) 0.50 0.177 1.0 0.283 2.0 0.365 3.0 0.597 4.0 0.769 5.0 0.911 Use this graph to answer the following questions: The equation for the line is in the form "y = mx + b", where m is the slope, and b is the intercept. What is the slope of the line? (Neglect units). What is the intercept of the line? (Neglect units). You next add 50 mL of your unknown sample to a 100 mL volumetric flask, treat it with hydroxylamine, o-phenanthroline, and citrate as described above, dilute to the mark, and determine the absorbance of the diluted sample to be 0.578 What is the concentration of Fe in your unknown?
You prepare a standard solution of ferrous ammonium sulfate that is 50.0 ppm in Fe. You pipette aliquots of 0.50 mL, 1.00 mL, 2.00 mL, 4.00 mL, 8.00 mL, and 10.00 mL into 100-mL volumetric flasks, add 1 mL of hydroxylamine solution, 3 mL of o-phenanthroline solution, and sufficient citrate to adjust to pH 3-4 as described in your laboratory instructions. After diluting each sample to the 100 mL mark, and allowing time for the color to develop, you record the absorbances shown the table. The data is a bit scattered. Looks like your pipetting ability could use some improvement. However, you can still use this data as a calibration curve. Plot the data in Excel, obtain a trendline and the equation for the linear regression line. Print the graph with the equation and turn to your laboratory instructor with your name and section printed at the top. Fe Conc. Absorbance (ppm) 0.50 0.177 1.0 0.283 2.0 0.365 3.0 0.597 4.0 0.769 5.0 0.911 Use this graph to answer the following questions: The equation for the line is in the form "y = mx + b", where m is the slope, and b is the intercept. What is the slope of the line? (Neglect units). What is the intercept of the line? (Neglect units). You next add 50 mL of your unknown sample to a 100 mL volumetric flask, treat it with hydroxylamine, o-phenanthroline, and citrate as described above, dilute to the mark, and determine the absorbance of the diluted sample to be 0.578 What is the concentration of Fe in your unknown?

Introductory Chemistry: A Foundation
9th Edition
ISBN:9781337399425
Author:Steven S. Zumdahl, Donald J. DeCoste
Publisher:Steven S. Zumdahl, Donald J. DeCoste
Chapter15: Solutions
Section: Chapter Questions
Problem 14ALQ

Related questions
Question
100%
Transcribed Image Text:You prepare a standard solution of ferrous ammonium sulfate that is 50.0 ppm in Fe. You pipette aliquots of 0.50 mL, 1.00 mL, 2.00 mL, 4.00 mL, 8.00 mL, and 10.00 mL into 100-mL volumetric
flasks, add 1 mL of hydroxylamine solution, 3 mL of o-phenanthroline solution, and sufficient citrate to adjust to pH 3-4 as described in your laboratory instructions. After diluting each sample to the
100 mL mark, and allowing time for the color to develop, you record the absorbances shown in the table.
The data is a bit scattered. Looks like your pipetting ability could use some improvement. However, you can still use this data as a calibration curve. Plot the data in Excel, obtain a trendline and the
equation for the linear regression line.
Print the graph with the equation and turn to your laboratory instructor with your name and section printed at the top.
Absorbance
Fe Conc.
(ppm)
0.50
0.177
1.0
0.283
2.0
0.365
3.0
0.597
4.0
0.769
5.0
0.911
Use this graph to answer the following questions:
The equation for the line is in the form "y = mx + b", where m is the slope, and b is the intercept.
What is the slope of the line? (Neglect units).
What is the intercept of the line? (Neglect units).
4.0✔
You next add 50 mL of your unknown sample to a 100 mL volumetric flask, treat it with hydroxylamine, o-phenanthroline, and citrate as described above, dilute to the mark, and determine the
absorbance of the diluted sample to be 0.578
What is the concentration of Fe in your unknown?
4.0✔
Expert Solution
This question has been solved!
Explore an expertly crafted, step-by-step solution for a thorough understanding of key concepts.

This is a popular solution!

Trending now
This is a popular solution!

Step by step
Solved in 4 steps with 3 images

Knowledge Booster


Learn more about
Need a deep-dive on the concept behind this application? Look no further. Learn more about this topic, chemistry and related others by exploring similar questions and additional content below.Recommended textbooks for you
Introductory Chemistry: A Foundation
Chemistry
ISBN:
9781337399425
Author:
Steven S. Zumdahl, Donald J. DeCoste
Publisher:
Cengage Learning

Chemistry & Chemical Reactivity
Chemistry
ISBN:
9781337399074
Author:
John C. Kotz, Paul M. Treichel, John Townsend, David Treichel
Publisher:
Cengage Learning

Chemistry: Principles and Reactions
Chemistry
ISBN:
9781305079373
Author:
William L. Masterton, Cecile N. Hurley
Publisher:
Cengage Learning
Introductory Chemistry: A Foundation
Chemistry
ISBN:
9781337399425
Author:
Steven S. Zumdahl, Donald J. DeCoste
Publisher:
Cengage Learning
Chemistry & Chemical Reactivity
Chemistry
ISBN:
9781337399074
Author:
John C. Kotz, Paul M. Treichel, John Townsend, David Treichel
Publisher:
Cengage Learning
Chemistry: Principles and Reactions
Chemistry
ISBN:
9781305079373
Author:
William L. Masterton, Cecile N. Hurley
Publisher:
Cengage Learning

Chemistry
Chemistry
ISBN:
9781305957404
Author:
Steven S. Zumdahl, Susan A. Zumdahl, Donald J. DeCoste
Publisher:
Cengage Learning

Chemistry: An Atoms First Approach
Chemistry
ISBN:
9781305079243
Author:
Steven S. Zumdahl, Susan A. Zumdahl
Publisher:
Cengage Learning
