You randomly select 14 student cars and find they have a mean age of 7.3 years and a standard deviation of 3.6 years. You also random select 18 faculty cars and find they have a mean age of 5.3 years and a standard deviation of 3.3 years. 1. Use a 0.01 significance level to test the claim that student cars are older than faculty cars. (a) The test statistic is 1.62 (b) The P-value is (give to 4 decimal places): 0.0563 2. Construct a 99% confidence interval estimate of the difference u, - Hf, where u, is the mean age of student cars and uf is the mean age of faculty cars. (give answers to at least 3 decimal places) 2.547 < (us - Hf) < 6.547
You randomly select 14 student cars and find they have a mean age of 7.3 years and a standard deviation of 3.6 years. You also random select 18 faculty cars and find they have a mean age of 5.3 years and a standard deviation of 3.3 years. 1. Use a 0.01 significance level to test the claim that student cars are older than faculty cars. (a) The test statistic is 1.62 (b) The P-value is (give to 4 decimal places): 0.0563 2. Construct a 99% confidence interval estimate of the difference u, - Hf, where u, is the mean age of student cars and uf is the mean age of faculty cars. (give answers to at least 3 decimal places) 2.547 < (us - Hf) < 6.547

Glencoe Algebra 1, Student Edition, 9780079039897, 0079039898, 2018
18th Edition
ISBN:9780079039897
Author:Carter
Publisher:Carter
Chapter10: Statistics
Section10.4: Distributions Of Data
Problem 19PFA

Related questions
Question
Please see below. I'm completely stumped on what the answers should be for the p-value and the 99% confidence interval. P-value is not: 0.5785, 0.0578, or 0.0563. The confidence interval is not what is pictured and -1.3644; 5.3644.
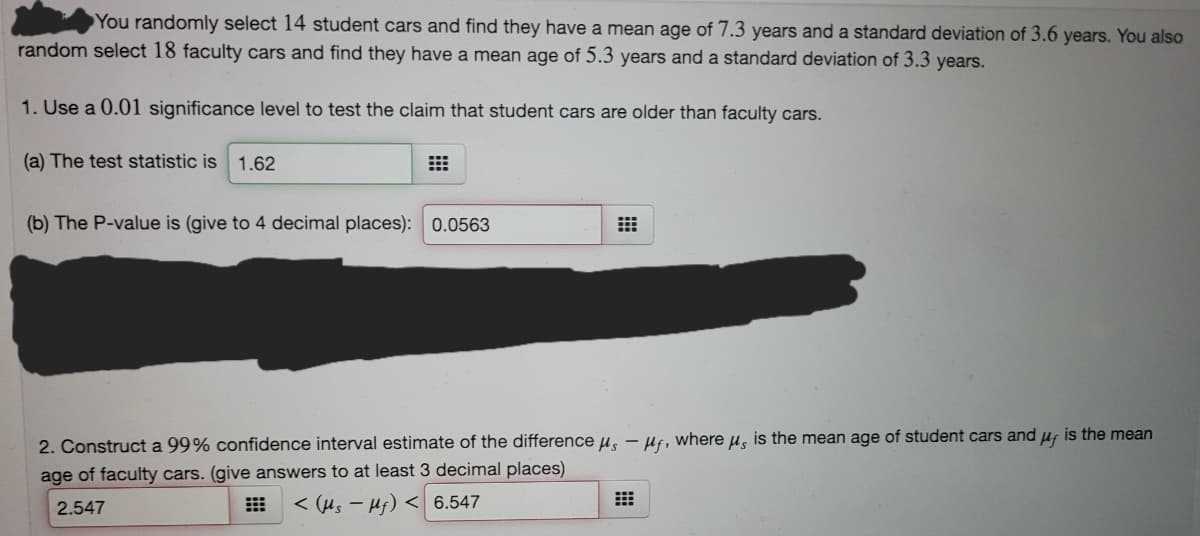
Transcribed Image Text:You randomly select 14 student cars and find they have a mean age of 7.3 years and a standard deviation of 3.6 years. You also
random select 18 faculty cars and find they have a mean age of 5.3 years and a standard deviation of 3.3 years.
1. Use a 0.01 significance level to test the claim that student cars are older than faculty cars.
(a) The test statistic is 1.62
(b) The P-value is (give to 4 decimal places): 0.0563
2. Construct a 99% confidence interval estimate of the difference µ̟ – Hf, where µ, is the mean age of student cars and uf is the mean
age of faculty cars. (give answers to at least 3 decimal places)
2.547
E < (Hs – Hj) < 6.547
Expert Solution
This question has been solved!
Explore an expertly crafted, step-by-step solution for a thorough understanding of key concepts.

Step by step
Solved in 3 steps with 1 images

Recommended textbooks for you
Glencoe Algebra 1, Student Edition, 9780079039897…
Algebra
ISBN:
9780079039897
Author:
Carter
Publisher:
McGraw Hill
Glencoe Algebra 1, Student Edition, 9780079039897…
Algebra
ISBN:
9780079039897
Author:
Carter
Publisher:
McGraw Hill