You take a random sample of 50 people and record their body weight in kilograms. Surprisingly, there are no two people with the same weight. Which of the following graphs would best summarize your data set? Line chart, or time series plot. Bar chart. Stem-and-leaf plot. Dot plot. Pie chart.
You take a random sample of 50 people and record their body weight in kilograms. Surprisingly, there are no two people with the same weight. Which of the following graphs would best summarize your data set? Line chart, or time series plot. Bar chart. Stem-and-leaf plot. Dot plot. Pie chart.

Glencoe Algebra 1, Student Edition, 9780079039897, 0079039898, 2018
18th Edition
ISBN:9780079039897
Author:Carter
Publisher:Carter
Chapter10: Statistics
Section10.6: Summarizing Categorical Data
Problem 4DGP

Related questions
Question
Q21 Asap
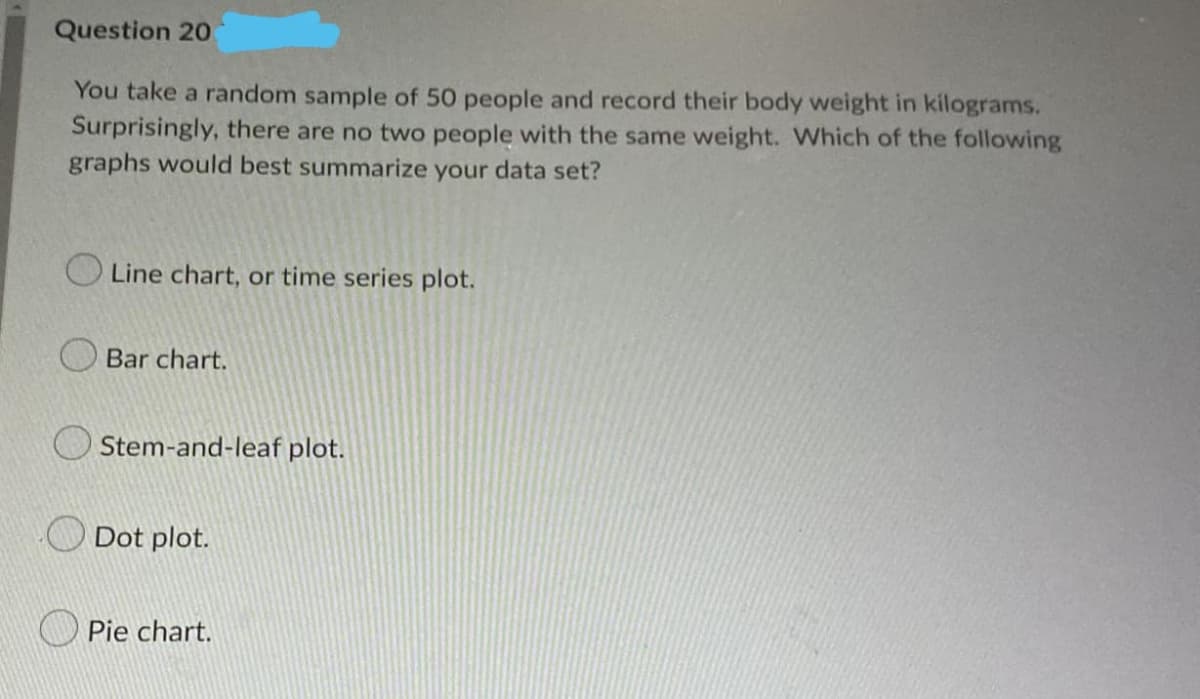
Transcribed Image Text:Question 20
You take a random sample of 50 people and record their body weight in kilograms.
Surprisingly, there are no two people with the same weight. Which of the following
graphs would best summarize your data set?
O Line chart, or time series plot.
O Bar chart.
Stem-and-leaf plot.
Dot plot.
Pie chart.
Expert Solution
This question has been solved!
Explore an expertly crafted, step-by-step solution for a thorough understanding of key concepts.

Step by step
Solved in 2 steps

Recommended textbooks for you
Glencoe Algebra 1, Student Edition, 9780079039897…
Algebra
ISBN:
9780079039897
Author:
Carter
Publisher:
McGraw Hill

Big Ideas Math A Bridge To Success Algebra 1: Stu…
Algebra
ISBN:
9781680331141
Author:
HOUGHTON MIFFLIN HARCOURT
Publisher:
Houghton Mifflin Harcourt

Intermediate Algebra
Algebra
ISBN:
9781285195728
Author:
Jerome E. Kaufmann, Karen L. Schwitters
Publisher:
Cengage Learning
Glencoe Algebra 1, Student Edition, 9780079039897…
Algebra
ISBN:
9780079039897
Author:
Carter
Publisher:
McGraw Hill
Big Ideas Math A Bridge To Success Algebra 1: Stu…
Algebra
ISBN:
9781680331141
Author:
HOUGHTON MIFFLIN HARCOURT
Publisher:
Houghton Mifflin Harcourt
Intermediate Algebra
Algebra
ISBN:
9781285195728
Author:
Jerome E. Kaufmann, Karen L. Schwitters
Publisher:
Cengage Learning