You want to see if it makes a difference which lane to be in when there is traffic. You randomly observe 260 cars as they pass by on the four lane freeway. The results are displayed in the table below. Use a level of significance of a = 0.01. a. Complete the rest of the table by filling in the expected frequencies: Frequency of Cars in Each Lane Outcome Frequency Expected Frequency Lane 1 73 Lane 2 82 Lane 3 41 Lane 4 64 b. What is the correct statistical test to use? Select an answer c. What are the null and alternative hypotheses? Но: The distribution of traffic is uniform. The traffic and lanes are independent. The distribution of traffic is not uniform. The traffic and lanes are dependent. H1: The distribution of traffic is uniform. The traffic and lanes are independent. The traffic and lanes are dependent.
You want to see if it makes a difference which lane to be in when there is traffic. You randomly observe 260 cars as they pass by on the four lane freeway. The results are displayed in the table below. Use a level of significance of a = 0.01. a. Complete the rest of the table by filling in the expected frequencies: Frequency of Cars in Each Lane Outcome Frequency Expected Frequency Lane 1 73 Lane 2 82 Lane 3 41 Lane 4 64 b. What is the correct statistical test to use? Select an answer c. What are the null and alternative hypotheses? Но: The distribution of traffic is uniform. The traffic and lanes are independent. The distribution of traffic is not uniform. The traffic and lanes are dependent. H1: The distribution of traffic is uniform. The traffic and lanes are independent. The traffic and lanes are dependent.

Glencoe Algebra 1, Student Edition, 9780079039897, 0079039898, 2018
18th Edition
ISBN:9780079039897
Author:Carter
Publisher:Carter
Chapter10: Statistics
Section10.6: Summarizing Categorical Data
Problem 42PFA

Related questions
Question
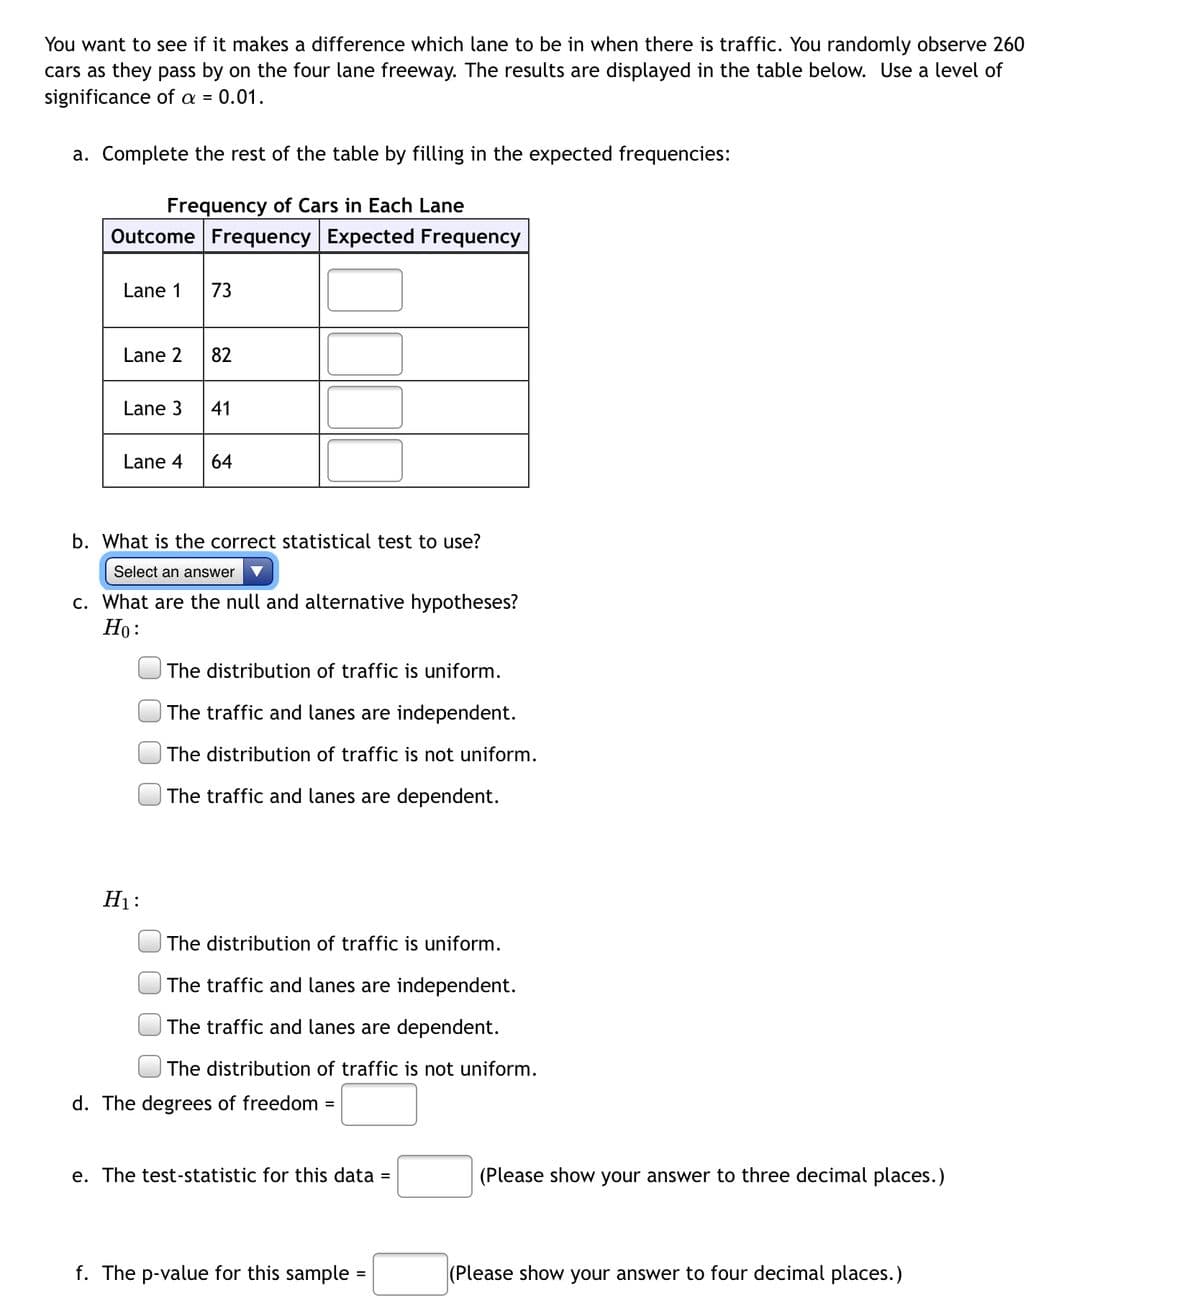
Transcribed Image Text:You want to see if it makes a difference which lane to be in when there is traffic. You randomly observe 260
cars as they pass by on the four lane freeway. The results are displayed in the table below. Use a level of
significance of a =
= 0.01.
a. Complete the rest of the table by filling in the expected frequencies:
Frequency of Cars in Each Lane
Outcome Frequency Expected Frequency
Lane 1
73
Lane 2
82
Lane 3
Lane 4
64
b. What is the correct statistical test to use?
Select an answer
c. What are the null and alternative hypotheses?
Но:
|The distribution of traffic is uniform.
The traffic and lanes are independent.
The distribution of traffic is not uniform.
The traffic and lanes are dependent.
H1:
| The distribution of traffic is uniform.
The traffic and lanes are independent.
The traffic and lanes are dependent.
The distribution of traffic is not uniform.
d. The degrees of freedom
e. The test-statistic for this data =
(Please show your answer to three decimal places.)
f. The p-value for this sample =
(Please show your answer to four decimal places.)
%3D
41
Expert Solution
This question has been solved!
Explore an expertly crafted, step-by-step solution for a thorough understanding of key concepts.

Step by step
Solved in 4 steps

Recommended textbooks for you
Glencoe Algebra 1, Student Edition, 9780079039897…
Algebra
ISBN:
9780079039897
Author:
Carter
Publisher:
McGraw Hill

Holt Mcdougal Larson Pre-algebra: Student Edition…
Algebra
ISBN:
9780547587776
Author:
HOLT MCDOUGAL
Publisher:
HOLT MCDOUGAL
Glencoe Algebra 1, Student Edition, 9780079039897…
Algebra
ISBN:
9780079039897
Author:
Carter
Publisher:
McGraw Hill
Holt Mcdougal Larson Pre-algebra: Student Edition…
Algebra
ISBN:
9780547587776
Author:
HOLT MCDOUGAL
Publisher:
HOLT MCDOUGAL