You wish to determine if there is a linear correlation between the age of a driver and the number of driver deaths. The following table represents the age of a driver and the number of driver deaths per 100,000. Use a significance level of 0.01 and round all values to 4 decimal places. Driver Age 44 77 20 55 16 77 Ho: p = 0 Ha: p = 0 Find the Linear Correlation Coefficient r = Find the p-value p-value = Number of Driver Deaths per 100,000 32 22 22 28 22 30 The p-value is O Greater than a O Less than (or equal to) a The p-value leads to a decision to O Do Not Reject Ho O Reject Ho O Accept Ho W The conclusion is O There is insufficient evidence to make a conclusion about the linear correlation between driver age and number of driver deaths. There is a significant positive linear correlation between driver age and number of driver deaths. O There is a significant linear correlation between driver age and number of driver deaths. O There is a significant negative linear correlation between driver age and number of driver deaths.
You wish to determine if there is a linear correlation between the age of a driver and the number of driver deaths. The following table represents the age of a driver and the number of driver deaths per 100,000. Use a significance level of 0.01 and round all values to 4 decimal places. Driver Age 44 77 20 55 16 77 Ho: p = 0 Ha: p = 0 Find the Linear Correlation Coefficient r = Find the p-value p-value = Number of Driver Deaths per 100,000 32 22 22 28 22 30 The p-value is O Greater than a O Less than (or equal to) a The p-value leads to a decision to O Do Not Reject Ho O Reject Ho O Accept Ho W The conclusion is O There is insufficient evidence to make a conclusion about the linear correlation between driver age and number of driver deaths. There is a significant positive linear correlation between driver age and number of driver deaths. O There is a significant linear correlation between driver age and number of driver deaths. O There is a significant negative linear correlation between driver age and number of driver deaths.

Glencoe Algebra 1, Student Edition, 9780079039897, 0079039898, 2018
18th Edition
ISBN:9780079039897
Author:Carter
Publisher:Carter
Chapter4: Equations Of Linear Functions
Section4.5: Correlation And Causation
Problem 15PPS

Related questions
Question
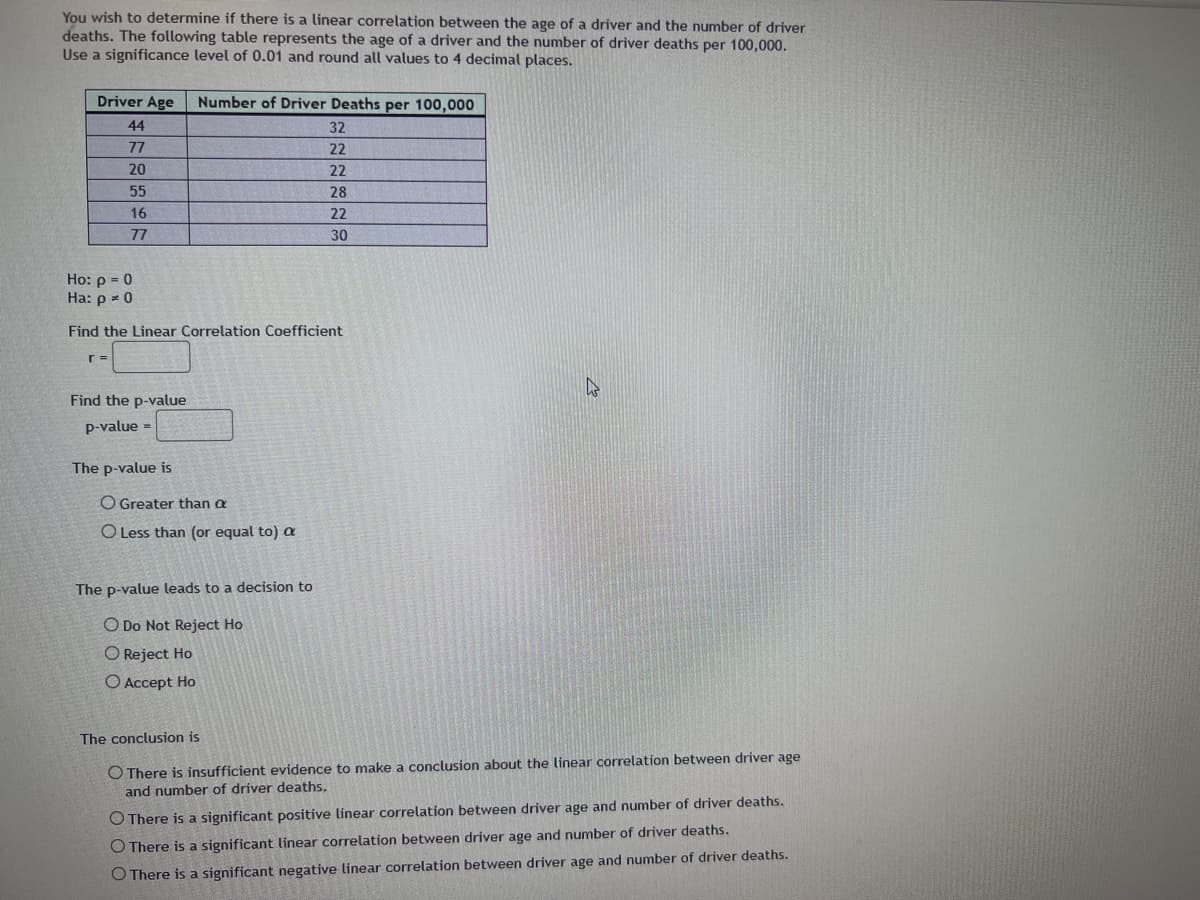
Transcribed Image Text:You wish to determine if there is a linear correlation between the age of a driver and the number of driver
deaths. The following table represents the age of a driver and the number of driver deaths per 100,000.
Use a significance level of 0.01 and round all values to 4 decimal places.
Driver Age
44
77
20
55
16
77
r =
Ho: p = 0
Ha: p = 0
Find the Linear Correlation Coefficient
Find the p-value
p-value =
Number of Driver Deaths per 100,000
32
22
The p-value is
O Greater than a
O Less than (or equal to) a
22
28
22
30
The p-value leads to a decision to
O Do Not Reject Ho
O Reject Ho
Accept Ho
W
The conclusion is
O There is insufficient evidence to make a conclusion about the linear correlation between driver age
and number of driver deaths.
There is a significant positive linear correlation between driver age and number of driver deaths.
O There is a significant linear correlation between driver age and number of driver deaths.
O There is a significant negative linear correlation between driver age and number of driver deaths.
Expert Solution
This question has been solved!
Explore an expertly crafted, step-by-step solution for a thorough understanding of key concepts.

Step by step
Solved in 4 steps with 1 images

Recommended textbooks for you
Glencoe Algebra 1, Student Edition, 9780079039897…
Algebra
ISBN:
9780079039897
Author:
Carter
Publisher:
McGraw Hill

Big Ideas Math A Bridge To Success Algebra 1: Stu…
Algebra
ISBN:
9781680331141
Author:
HOUGHTON MIFFLIN HARCOURT
Publisher:
Houghton Mifflin Harcourt

Algebra and Trigonometry (MindTap Course List)
Algebra
ISBN:
9781305071742
Author:
James Stewart, Lothar Redlin, Saleem Watson
Publisher:
Cengage Learning
Glencoe Algebra 1, Student Edition, 9780079039897…
Algebra
ISBN:
9780079039897
Author:
Carter
Publisher:
McGraw Hill
Big Ideas Math A Bridge To Success Algebra 1: Stu…
Algebra
ISBN:
9781680331141
Author:
HOUGHTON MIFFLIN HARCOURT
Publisher:
Houghton Mifflin Harcourt
Algebra and Trigonometry (MindTap Course List)
Algebra
ISBN:
9781305071742
Author:
James Stewart, Lothar Redlin, Saleem Watson
Publisher:
Cengage Learning