You wish to test if there is a relationship between soil temperature and plant abundance, so you measure soil temperature in 30 different plots within the forest, and count the number of plants in each plot. To test your hypothesis that plant abundance increases as soil temperature increases, you would make a and run a scatterplot; v-test O scatterplot; linear regression bar graph; t-test
You wish to test if there is a relationship between soil temperature and plant abundance, so you measure soil temperature in 30 different plots within the forest, and count the number of plants in each plot. To test your hypothesis that plant abundance increases as soil temperature increases, you would make a and run a scatterplot; v-test O scatterplot; linear regression bar graph; t-test

Linear Algebra: A Modern Introduction
4th Edition
ISBN:9781285463247
Author:David Poole
Publisher:David Poole
Chapter7: Distance And Approximation
Section7.3: Least Squares Approximation
Problem 31EQ

Related questions
Question
5
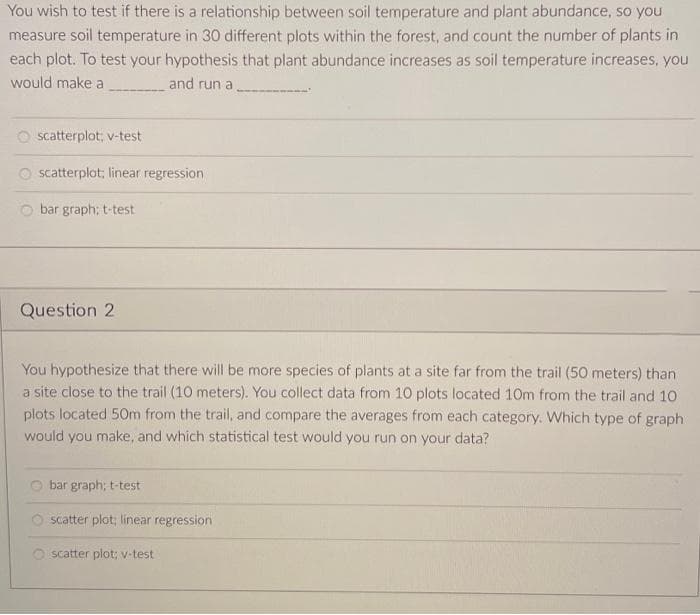
Transcribed Image Text:You wish to test if there is a relationship between soil temperature and plant abundance, so you
measure soil temperature in 30 different plots within the forest, and count the number of plants in
each plot. To test your hypothesis that plant abundance increases as soil temperature increases, you
would make a
and run a
scatterplot; v-test
O scatterplot; linear regression
bar graph; t-test
Question 2
You hypothesize that there will be more species of plants at a site far from the trail (50 meters) than
a site close to the trail (10 meters). You collect data from 10 plots located 10m from the trail and 10
plots located 50m from the trail, and compare the averages from each category. Which type of graph
would you make, and which statistical test would you run on your data?
bar graph; t-test
scatter plot; linear regression
O scatter plot; v-test
Expert Solution
This question has been solved!
Explore an expertly crafted, step-by-step solution for a thorough understanding of key concepts.

Step by step
Solved in 2 steps

Recommended textbooks for you
Linear Algebra: A Modern Introduction
Algebra
ISBN:
9781285463247
Author:
David Poole
Publisher:
Cengage Learning


Glencoe Algebra 1, Student Edition, 9780079039897…
Algebra
ISBN:
9780079039897
Author:
Carter
Publisher:
McGraw Hill
Linear Algebra: A Modern Introduction
Algebra
ISBN:
9781285463247
Author:
David Poole
Publisher:
Cengage Learning
Glencoe Algebra 1, Student Edition, 9780079039897…
Algebra
ISBN:
9780079039897
Author:
Carter
Publisher:
McGraw Hill

Big Ideas Math A Bridge To Success Algebra 1: Stu…
Algebra
ISBN:
9781680331141
Author:
HOUGHTON MIFFLIN HARCOURT
Publisher:
Houghton Mifflin Harcourt

Functions and Change: A Modeling Approach to Coll…
Algebra
ISBN:
9781337111348
Author:
Bruce Crauder, Benny Evans, Alan Noell
Publisher:
Cengage Learning