You wish to test the following claim (H) at a significance level of a = 0.001. For the context of this problem, Hd PostTest - PreTest where the first data set represents a pre-test and the second data set represents a post-test. (Each row represents the pre and post test scores for an individual. Be careful when you enter your data and specify what your #₁ and 4₂ are so that the differences are computed correctly.) Ho: Hd=0 Ha: Pd 0 You believe the population of difference scores is normally distributed, but you do not know the standard deviation. You obtain the following sample of data: pre-test post-test 43 44.8 48.1 52.8 60.8 37.8 39.2 51.6 69.6 53 42.4 55.4 Ở 51.6 49.6 55.7 51.8 61.3 34.6 49.2 ✔ 53.7 56.7 42.4 The p-value is.... 64.4 -23.8 34.4 9.4 24.8 106.5 -105 82.8 72.8 107 61.7 -26.1 21.7 32.1 -19.9 61.6 What is the test statistic for this sample? test statistic 69.4 -56.1 4.5 9 -1.3 27.4 What is the p-value for this sample? p-value= (Report answer accurate to 4 decimal places.) (Report answer accurate to 4 decimal places.) O less than (or equal to) a greater than a This test statistic leads to a decision to... O reject the null O accept the null fail to reject the null As such, the final conclusion is that... There is sufficient evidence to warrant rejection of the claim that the mean difference of post-test from pre-test is not equal to 0. O There is not sufficient evidence to warrant rejection of the claim that the mean difference of post-test from pre-test is not equal to 0. O The sample data support the claim that the mean difference of post-test from pre-test is not equal to 0. There is not sufficient sample evidence to support the claim that the mean difference of post-test from pre-test is not equal to 0.
You wish to test the following claim (H) at a significance level of a = 0.001. For the context of this problem, Hd PostTest - PreTest where the first data set represents a pre-test and the second data set represents a post-test. (Each row represents the pre and post test scores for an individual. Be careful when you enter your data and specify what your #₁ and 4₂ are so that the differences are computed correctly.) Ho: Hd=0 Ha: Pd 0 You believe the population of difference scores is normally distributed, but you do not know the standard deviation. You obtain the following sample of data: pre-test post-test 43 44.8 48.1 52.8 60.8 37.8 39.2 51.6 69.6 53 42.4 55.4 Ở 51.6 49.6 55.7 51.8 61.3 34.6 49.2 ✔ 53.7 56.7 42.4 The p-value is.... 64.4 -23.8 34.4 9.4 24.8 106.5 -105 82.8 72.8 107 61.7 -26.1 21.7 32.1 -19.9 61.6 What is the test statistic for this sample? test statistic 69.4 -56.1 4.5 9 -1.3 27.4 What is the p-value for this sample? p-value= (Report answer accurate to 4 decimal places.) (Report answer accurate to 4 decimal places.) O less than (or equal to) a greater than a This test statistic leads to a decision to... O reject the null O accept the null fail to reject the null As such, the final conclusion is that... There is sufficient evidence to warrant rejection of the claim that the mean difference of post-test from pre-test is not equal to 0. O There is not sufficient evidence to warrant rejection of the claim that the mean difference of post-test from pre-test is not equal to 0. O The sample data support the claim that the mean difference of post-test from pre-test is not equal to 0. There is not sufficient sample evidence to support the claim that the mean difference of post-test from pre-test is not equal to 0.

Glencoe Algebra 1, Student Edition, 9780079039897, 0079039898, 2018
18th Edition
ISBN:9780079039897
Author:Carter
Publisher:Carter
Chapter10: Statistics
Section10.3: Measures Of Spread
Problem 1GP

Related questions
Question
I am having difficulty finding the correct test statistic. I tried 2.2987, which was incorrect.
I would be grateful for any help at all, thanks so much! :)
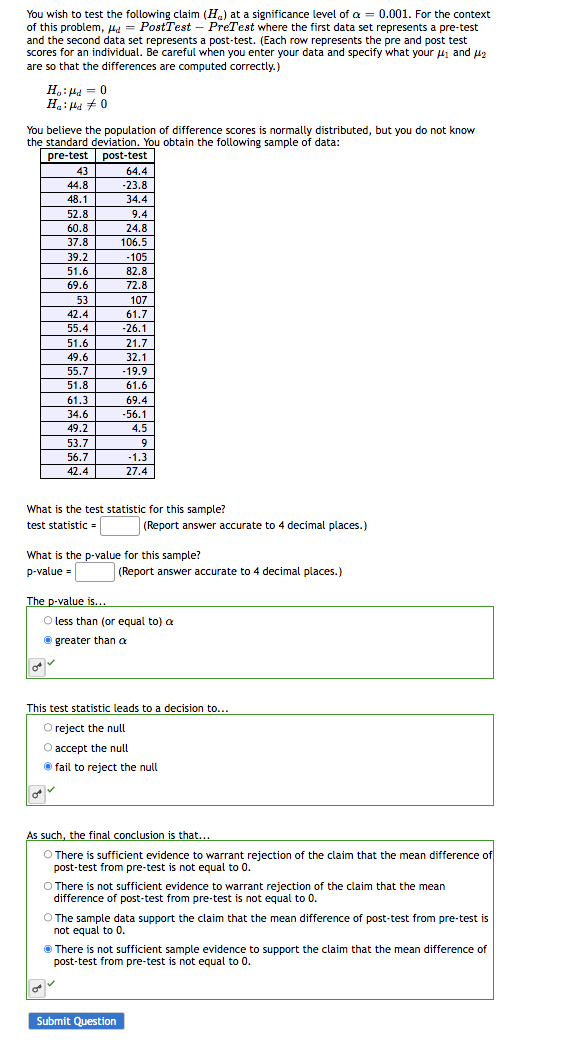
Transcribed Image Text:You wish to test the following claim (H) at a significance level of a = 0.001. For the context
of this problem, d = PostTest - PreTest where the first data set represents a pre-test
and the second data set represents a post-test. (Each row represents the pre and post test
scores for an individual. Be careful when you enter your data and specify what your #₁ and ₂
are so that the differences are computed correctly.)
You believe the population of difference scores is normally distributed, but you do not know
the standard deviation. You obtain the following sample of data:
pre-test post-test
Ho: Hd = 0
Had 0
43
44.8
48.1
on
52.8
60.8
37.8
39.2
51.6
69.6
0
53
42.4
55.4
51.6
49.6
55.7
51.8
61.3
34.6
49.2
53.7
56.7
42.4
The p-value is...
64.4
-23.8
34.4
9.4
24.8
106.5
What is the test statistic for this sample?
test statistic =
-105
82.8
72.8
107
61.7
-26.1
21.7
32.1
-19.9
61.6
69.4
-56.1
What is the p-value for this sample?
p-value =
4.5
9
-1.3
27.4
(Report answer accurate to 4 decimal places.)
Submit Question
(Report answer accurate to 4 decimal places.)
O less than (or equal to) a
greater than a
This test statistic leads to a decision to...
O reject the null
O accept the null
Ⓒfail to reject the null
As such, the final conclusion is that...
O There is sufficient evidence to warrant rejection of the claim that the mean difference of
post-test from pre-test is not equal to 0.
O There is not sufficient evidence to warrant rejection of the claim that the mean
difference of post-test from pre-test is not equal to 0.
O The sample data support the claim that the mean difference of post-test from pre-test is
You
not equal to 0.
There is not sufficient sample evidence to support the claim that the mean difference of
post-test from pre-test is not equal to 0.
Expert Solution
This question has been solved!
Explore an expertly crafted, step-by-step solution for a thorough understanding of key concepts.

Step by step
Solved in 2 steps

Recommended textbooks for you
Glencoe Algebra 1, Student Edition, 9780079039897…
Algebra
ISBN:
9780079039897
Author:
Carter
Publisher:
McGraw Hill
Glencoe Algebra 1, Student Edition, 9780079039897…
Algebra
ISBN:
9780079039897
Author:
Carter
Publisher:
McGraw Hill