Your friend is thinking about buying shares of stock in a company. You have been tracking the closing prices of the stock shares for the past 90 trading days. Which type of graph for the data would be best to show your friend? circle graph none of these choices histogram time-series graph O pareto chart
Your friend is thinking about buying shares of stock in a company. You have been tracking the closing prices of the stock shares for the past 90 trading days. Which type of graph for the data would be best to show your friend? circle graph none of these choices histogram time-series graph O pareto chart

Chapter9: Sequences, Probability And Counting Theory
Section9.4: Series And Their Notations
Problem 3SE: What is a geometric series?

Related questions
Question
Please answer this question: show work!!
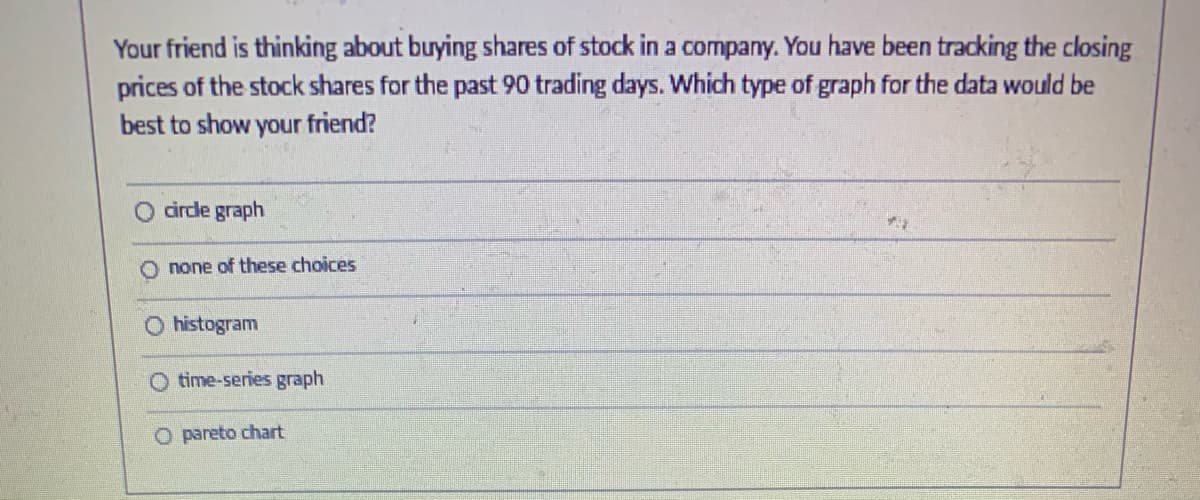
Transcribed Image Text:Your friend is thinking about buying shares of stock in a company. You have been tracking the closing
prices of the stock shares for the past 90 trading days. Which type of graph for the data would be
best to show your friend?
circle graph
none of these choices
O histogram
time-series graph
O pareto chart
Expert Solution
This question has been solved!
Explore an expertly crafted, step-by-step solution for a thorough understanding of key concepts.

This is a popular solution!

Trending now
This is a popular solution!

Step by step
Solved in 3 steps

Recommended textbooks for you