your score in the original distribution?

Glencoe Algebra 1, Student Edition, 9780079039897, 0079039898, 2018
18th Edition
ISBN:9780079039897
Author:Carter
Publisher:Carter
Chapter10: Statistics
Section10.4: Distributions Of Data
Problem 22PFA

Related questions
Question
100%
With solution please
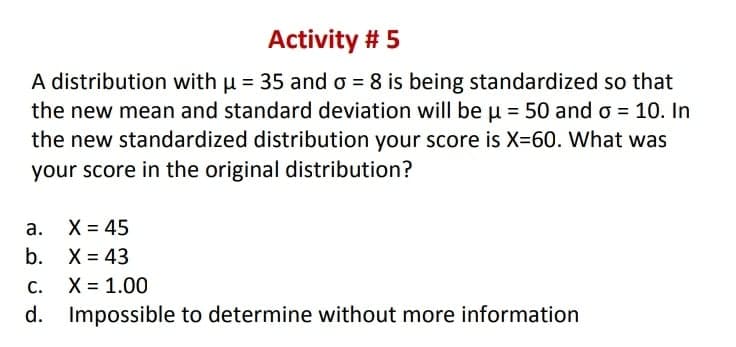
Transcribed Image Text:Activity # 5
A distribution with u = 35 and o = 8 is being standardized so that
the new mean and standard deviation will be u = 50 and o = 10. In
the new standardized distribution your score is X=60. What was
your score in the original distribution?
а. Х%3D45
b. X = 43
С.
X = 1.00
d.
Impossible to determine without more information
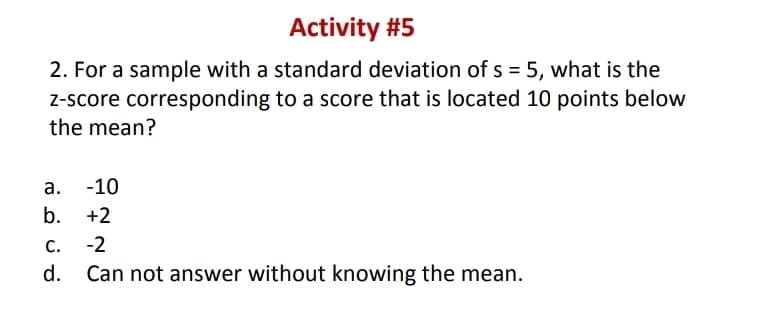
Transcribed Image Text:Activity #5
2. For a sample with a standard deviation of s = 5, what is the
Z-score corresponding to a score that is located 10 points below
the mean?
а.
-10
b. +2
С.
-2
d.
Can not answer without knowing the mean.
Expert Solution
This question has been solved!
Explore an expertly crafted, step-by-step solution for a thorough understanding of key concepts.

This is a popular solution!

Trending now
This is a popular solution!

Step by step
Solved in 2 steps with 3 images

Recommended textbooks for you
Glencoe Algebra 1, Student Edition, 9780079039897…
Algebra
ISBN:
9780079039897
Author:
Carter
Publisher:
McGraw Hill
Glencoe Algebra 1, Student Edition, 9780079039897…
Algebra
ISBN:
9780079039897
Author:
Carter
Publisher:
McGraw Hill