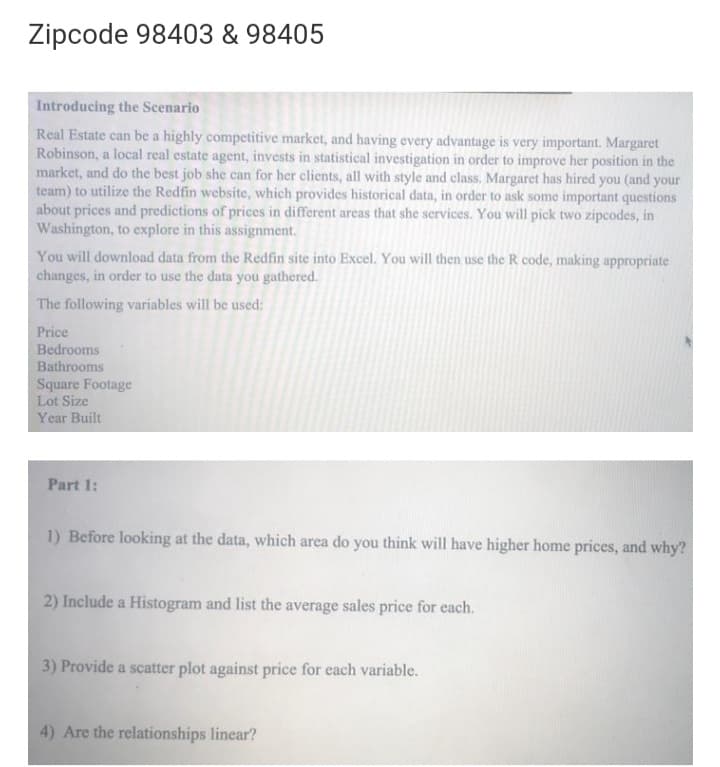
Zipcode 98403 & 98405 Introducing the Scenario Real Estate can be a highly competitive market, and having every advantage is very important. Margaret Robinson, a local real estate agent, invests in statistical investigation in order to improve her position in the market, and do the best job she can for her clients, all with style and class. Margaret has hired you (and your team) to utilize the Redfin website, which provides historical data, in order to ask some important questions about prices and predictions of prices in different areas that she services. You will pick two zipcodes, in Washington, to explore in this assignment. You will download data from the Redfin site into Excel. You will then use the R code, making appropriate changes, in order to use the data you gathered. The following variables will be used: Price Bedrooms Bathrooms Square Footage Lot Size Year Built Part 1: 1) Before looking at the data, which area do you think will have higher home prices, and why? 2) Include a Histogram and list the average sales price for each. 3) Provide a scatter plot against price for each variable. 4) Are the relationships linear?
Zipcode 98403 & 98405 Introducing the Scenario Real Estate can be a highly competitive market, and having every advantage is very important. Margaret Robinson, a local real estate agent, invests in statistical investigation in order to improve her position in the market, and do the best job she can for her clients, all with style and class. Margaret has hired you (and your team) to utilize the Redfin website, which provides historical data, in order to ask some important questions about prices and predictions of prices in different areas that she services. You will pick two zipcodes, in Washington, to explore in this assignment. You will download data from the Redfin site into Excel. You will then use the R code, making appropriate changes, in order to use the data you gathered. The following variables will be used: Price Bedrooms Bathrooms Square Footage Lot Size Year Built Part 1: 1) Before looking at the data, which area do you think will have higher home prices, and why? 2) Include a Histogram and list the average sales price for each. 3) Provide a scatter plot against price for each variable. 4) Are the relationships linear?
Glencoe Algebra 1, Student Edition, 9780079039897, 0079039898, 2018
18th Edition
ISBN:9780079039897
Author:Carter
Publisher:Carter
Chapter10: Statistics
Section10.6: Summarizing Categorical Data
Problem 27PPS
Related questions
Question
2

Transcribed Image Text:Zipcode 98403 & 98405
Introducing the Scenario
Real Estate can be a highly competitive market, and having every advantage is very important. Margaret
Robinson, a local real estate agent, invests in statistical investigation in order to improve her position in the
market, and do the best job she can for her clients, all with style and class. Margaret has hired you (and your
team) to utilize the Redfin website, which provides historical data, in order to ask some important questions
about prices and predictions of prices in different areas that she services. You will pick two zipcodes, in
Washington, to explore in this assignment.
You will download data from the Redfin site into Excel. You will then use the R code, making appropriate
changes, in order to use the data you gathered.
The following variables will be used:
Price
Bedrooms
Bathrooms
Square Footage
Lot Size
Year Built
Part 1:
1) Before looking at the data, which area do you think will have higher home prices, and why?
2) Include a Histogram and list the average sales price for each.
3) Provide a scatter plot against price for each variable.
4) Are the relationships linear?
Expert Solution
This question has been solved!
Explore an expertly crafted, step-by-step solution for a thorough understanding of key concepts.
This is a popular solution!
Trending now
This is a popular solution!
Step by step
Solved in 3 steps with 5 images

Recommended textbooks for you

Glencoe Algebra 1, Student Edition, 9780079039897…
Algebra
ISBN:
9780079039897
Author:
Carter
Publisher:
McGraw Hill

Glencoe Algebra 1, Student Edition, 9780079039897…
Algebra
ISBN:
9780079039897
Author:
Carter
Publisher:
McGraw Hill