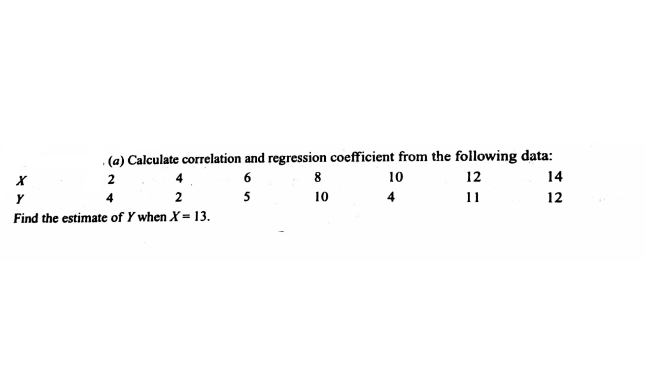
. (a) Calculate correlation and regression coefficient from the following data: 14 2 6 8 10 12 4 2 5 10 4 11 12 Find the estimate of Y when X= 13.


Q: Show that the correlation coefficient is independent of the origin of reference and the units of mea...
A: We need to to prove that correlation coefficient is independent of the origin and units of measureme...
Q: lustration 27. For a bivariate data, you are given the following information: E(X- 58) = 46 EX- 58)*...
A: Correlation is used to measure the association between the two variable which are numerical. It is d...
Q: Calculate the coefficient of association between delinquency and income groups.
A: The given data can be described as Higher income Lower income Total Delinquent 25 (AB) 100 (A...
Q: Days until Changes Probability 1.5 0.15 3.0 0.15 4.5 0.40 5.0 0.20 7.0 0.10 Let the random variable ...
A:
Q: Do you find any association between the tempers of brothers and sisters from the FOHowing data : Goo...
A: We need to test the association between temper of brothers and sisters
Q: oy be regarded as a RV having an Erlang distribution with A = 1 and k = n In. If the sales cost is R...
A:
Q: Albert asked Joselito and Ana why they are amazed at the test. As Albert read the part of the test s...
A:
Q: 5. A combination lock has 50 numbers on it. To open it, you tum it counterclockwise to the 1" number...
A:
Q: A random sample of size n is taken from a general Gamma (Erlang) distribution with parameters 1 and ...
A:
Q: Find the margeinul denity go In Problim e. assume the obured valee ofXi x = 3 value 5(1/X3) Find the
A:
Q: c. What percentage of the variation in final scores is explained by the linear relationship between ...
A:
Q: 3. Recall that in a standard 52 card deck, there are four suits of 13 cards each, consisting of the ...
A: Given information Well shuffled cards =52 Spade cards=13 Club cards =13 diamond cards =13 Heart card...
Q: Testing for a Linear Correlation. In Exercises 13–28, construct a scatterplot, and find the value of...
A: Diameter (x) Circumference (y) xy x2 y2 7.4 23.2 171.68 54.76 538.24 23.9 75.1 1794.89 571.21 56...
Q: Theorem 3-6. If A and B are any two events (subsets of sample space S) and are not disjoint, then P(...
A:
Q: 20 Question 3 A bag of M&M's has 2 red, 5 green, 7 blue, and 4 yellow M&M's. What is the probabilit...
A:
Q: A store manager gathers some demographic information from the store's customers. The following chart...
A:
Q: Parliament contains a proportion p of Labour Party members, incapable of changing their opinions abo...
A: Given: P(A1) = p P(A2) = 1-p P(B|A1) = 1 P(B|A2) = 1-r
Q: If one of the pedestrian deaths is randomly selected, find the probability that the pedestrian was n...
A: Given: Pedestrian intoxicated Driver intoxicated Yes No Yes 46 66 No 270 599
Q: If one of the pedestrian deaths is randomly selected, find the probability that the driver was not i...
A: HERE GIVEN TABLE FOR RESULTS FROM PEDESTRIAN DEATHS
Q: Assume X is normally distributed with a mean of 12 anda standard deviation of 2. Determine the value...
A:
Q: Let X N(u, 1) of size n. Obtain UMVUE for u.
A: Given that Let X N(μ,1) of size n. Obtain UMVUE for μ
Q: A researcher is interested in estimating the supply function of an online car rental service provide...
A: Given information: The response variable is price. The predictor variables are car and income.
Q: 6. Danielle flips her coin three times. She's hopping for HHH or TTT. What are the complementary out...
A:
Q: Select the letter of the correct answer: A random variable X has a mean of 45 and a standard deviat...
A:
Q: Find the t-value when u = 18.5,i = 19, s= 2.5 and n = 16.
A: It is given that Sample size n = 16 Sample mean = 19 Population mean = 18.5 Sample SD = 2.5
Q: 200! 7) 198!
A: we know thatn!=n×(n-1)×(n-2)×......×1
Q: The line drawn within the box of the box-and-whisker plot represents the mean. TRUE FALSE
A:
Q: Let X be a binomial random variable with n=100 and p=0.25. As a reference, the precise probability t...
A: Given that : Sample size (n) = 100 Probability of success (P) = 0.25 P{x<= 30 } = 0.89621 By usin...
Q: Classify the following as nominal, ordinal, interval, and ratio. Degree changes in fever patient (v...
A: 1. Degree changes in fever patient (vast improvement, moderate improvement, no change, death) - Ord...
Q: A student goes to the library. Let events B = the student checks out a book and D = the student chec...
A:
Q: For a standard normal distribution, find: P(z < 2.74) Express the probability as a decimal rounded t...
A:
Q: 1. In the communication system below the probability of transmitting ("B" before) symbols 1 and are:...
A: From the given information, P(B1)=0.7 P(B0)=0.3 P(A1|B1)=0.8 P(A0|B1)=0.2 P(A0|B0)=0.9 P(A1|B0)=0.1 ...
Q: A triangle is formed by the building's height and shadow. Another triangle is formed by the flagpo...
A:
Q: The following table gives the age of cars of a certain make and annual maintenance Tost. Obtain the ...
A: The given table is the data for the age of cars and their maintenance. We need to find the regressio...
Q: website monitors customer complaints and organizes these complaints into six distinct categories. Ov...
A: Given The complaints are organized into 6 distinct categories. In 1 year, there are total 534 compla...
Q: A class contains 100 students, and each student belongs to one lab section. There are 3 lab sections...
A:
Q: Directions: Given the number of permutations of objects taken r at a time, show the permutations thr...
A:
Q: A teacher has a large container of blue, red, and green beads. She wants her students to estimate th...
A:
Q: hat sampling method should the researchers use if the study is about The Supply of Job Applications ...
A: Sampling Methods for conducting the survey Data are the basic material needed for effective statisti...
Q: Consider a probability density function (PDF), where f(T-t) is a general function, g(T) and h(t) are...
A:
Q: Find the value of kurtosis and describe the peakedness or flatness of the curve. Class Interval Clas...
A: Concentration of all the values around the central value of the given data is known as measures of c...
Q: Samples of laboratory glass are in small, light packaging or heavy, large packaging. Suppose that 2%...
A:
Q: 3. Replacements times of TV sets are reported to follow a normal distribution having a mean of 8.5 y...
A: Given that X~N(μ= 8.5 , σ= 1.2 ) μ= 8.5 , σ= 1.2 , n= 24 Formula for Z-score Z=(X-μ)/σ
Q: figure out what would happen if the D’Hondt method were applied to a four-party election for 10 seat...
A: D'Hondt method is a method to allocate the seats to the parties in an election approximately in the ...
Q: What is the area if the z-score given is -1.63? a. 0.9489 b. 0.9474 c. 0.9495 d. 0.9525
A:
Q: Similarly show that the F-statistic for the interaction is the square of the t-statistic for the con...
A:
Q: Assume that the readings at freezing on a bundle of thermometers are normally distributed with a mea...
A: Required probability is P(Z<-0.548)
Q: Given that Ep.g, = 250, Epa, - 150, Paasche's index number 150 and Dorbish - Bówley's index number 1...
A:
Q: State the dependent and independent variables in the following researches or studies. Research Depe...
A: HERE INDEPENDENT VARIABLE- IT IS CAUSE , IT IS REASON FOR CHANGES IN THE DEPENDENT VARIABLE DEPEND...
Q: In a study of hypnotic suggestion, 16 male volunteers were randomly allocated to a treatment group a...
A: Given Two groups- Treatment group and control group And their measurements of total ventilation fo...

Step by step
Solved in 2 steps with 2 images

- Find the equation of the regression line for the following data set. x 1 2 3 y 0 3 4For the following exercises, use Table 4 which shows the percent of unemployed persons 25 years or older who are college graduates in a particular city, by year. Based on the set of data given in Table 5, calculate the regression line using a calculator or other technology tool, and determine the correlation coefficient. Round to three decimal places of accuracyFor the following exercises, consider the data in Table 5, which shows the percent of unemployed in a city ofpeople25 years or older who are college graduates is given below, by year. 41. Based on the set of data given in Table 7, calculatethe regression line using a calculator or othertechnology tool, and determine the correlationcoefficient to three decimal places.
- For the following exercises, consider the data in Table 5, which shows the percent of unemployed ina city of people 25 years or older who are college graduates is given below, by year. 40. Based on the set of data given in Table 6, calculate the regression line using a calculator or other technology tool, and determine the correlation coefficient to three decimal places.Here is a bivariate data set.x y71 461 555 6148 -876 3126 7074 -62 Find the correlation coefficient and report it accurate to four decimal places.r =Here is a bivariate data set.x-10.835.238.830.937.535.3 y87.265.4138.45417.729.4 Find the correlation coefficient and report it accurate to three decimal places. r =
- The grades of a class of 9 students on a midterm report (x) and on the final examination (y) are as follows: Give the following: a. linear regression line and equation b. computation of the coefficient of determination ?^2 c. Computation of the coefficient of correlation ? d. Estimate the final examination grade of a student who received a grade of 85 on the midterm report.Consider the following regression equation representing the linear relationship between the Canada Child Benefit provided for a married couple with 3 children under the age of 6, based on their annual family net income: ŷ =121.09−0.57246xR2=0.894 where y = annual Canada Child Benefit paid (in $100s) x = net annual family income (in $1000s) Source: Canada Revenue Agency a. As the net annual family income increases, does the Canada Child Benefit paid increase or decrease? Based on this, is the correlation between the two variables positive or negative?The Canada Child Benefit paid .The correlation between the two variables is .b. Calculate the correlation coefficient and determine if the relationship between the two variables is strong, moderate or weak.r= , the relationship is . Round to 3 decimal places c. Interpret the value of the slope as it relates to this relationship. For every $1 increase in annual family net income, there is a $0.57246 decrease in…Consider the following regression equation representing the linear relationship between the Canada Child Benefit provided for a married couple with 3 children under the age of 6, based on their annual family net income: ŷ =121.09−0.57246xR2=0.894 where y= annual Canada Child Benefit paid (in $100s) x = net annual family income (in $1000s) Source: Canada Revenue Agency a. As the net annual family income increases, does the Canada Child Benefit paid increase or decrease? Based on this, is the correlation between the two variables positive or negative?The Canada Child Benefit paid ? .The correlation between the two variables is ? .b. Calculate the correlation coefficient and determine if the relationship between the two variables is strong, moderate or weak.r= , the relationship is ? . Round to 3 decimal places c. Interpret the value of the slope as it relates to this relationship. For every $1 increase in annual family net income, there is a $0.57246 decrease in…
- 2. The following data, adapted from Montgomery, Peck, and Vining (2001), present the number of certified mental defectives per 10,000 of estimated population in the United Kingdom ( y) and the number of radio receiver licenses issued (x) by the BBC (in millions) for the years 1924 through 1937. Fit a regression model relating y and x. Comment on the model. Specifically, does the existence of a strong correlation imply a cause-and-effect relationship?A major credit card company is interested in whether there is a linear relationship between its internal rating of a customer’s credit risk and that of an independent rating agency. The company collected a random sample of 200 customers and used the data to test the claim that there is a linear relationship. The following hypotheses were used to test the claim. H0:β1=0Ha:β1≠0 The test yielded a t-value of 3.34 with a corresponding p-value of 0.001. Which of the following is the correct interpretation of the p-value? If the alternative hypothesis is true, the probability of observing a test statistic at least as extreme as 3.34 is 0.001. If the alternative hypothesis is true, the probability of observing a test statistic at least as extreme as 3.34 is 0.001. A If the alternative hypothesis is true, the probability of observing a test statistic of 3.34 or greater is 0.001. If the alternative hypothesis is true, the probability of observing a test statistic of 3.34 or greater…Here is a bivariate data set.xy182425915011737106295223812246 Find the correlation coefficient and report it accurate to four decimal places. r =

