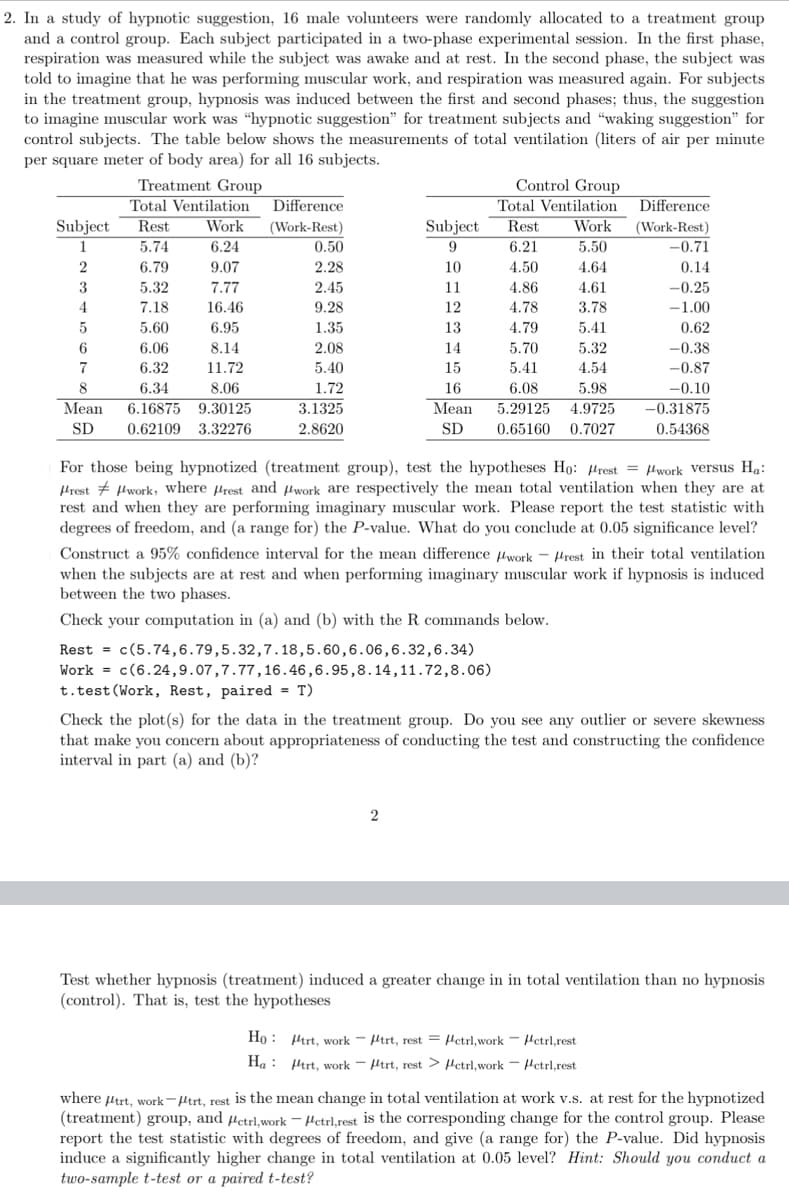
In a study of hypnotic suggestion, 16 male volunteers were randomly allocated to a treatment group and a control group. Each subject participated in a two-phase experimental session. In the first phase, respiration was measured while the subject was awake and at rest. In the second phase, the subject was told to imagine that he was performing muscular work, and respiration was measured again. For subjects in the treatment group, hypnosis was induced between the first and second phases; thus, the suggestion to imagine muscular work was "hypnotic suggestion" for treatment subjects and "waking suggestion" for control subjects. The table below shows the measurements of total ventilation (liters of air per minute per square meter of body area) for all 16 subjects. Treatment Group Control Group Total Ventilation Difference Total Ventilation Difference Subject Rest Work Subject Rest Work (Work-Rest) (Work-Rest) 0.50 1 5.74 6.24 9 6.21 5.50 -0.71 6.79 9.07 2.28 10 4.50 4.64 0.14 3 5.32 7.77 2.45 11 4.86 4.61 -0.25 4 7.18 16.46 9.28 12 4.78 3.78 -1.00 5 5.60 6.95 1.35 13 4.79 5.41 0.62 6. 6.06 8.14 2.08 14 5.70 5.32 -0.38 7 6.32 11.72 5.40 15 5.41 4.54 -0.87 8 6.34 8.06 1.72 16 6.08 5.98 -0.10 Mean 6.16875 9.30125 3.1325 Mean 5.29125 4.9725 -0.31875 SD 0.62109 3.32276 2.8620 SD 0.65160 0.7027 0.54368 For those being hypnotized (treatment group), test the hypotheses Ho: Hrest = Hwork versus Ha: Hrest # Hwork, where µrest and Hwork are respectively the mean total ventilation when they are at rest and when they are performing imaginary muscular work. Please report the test statistic with degrees of freedom, and (a range for) the P-value. What do you conclude at 0.05 significance level? Construct a 95% confidence interval for the mean difference Hwork - Hrest in their total ventilation when the subjects are at rest and when performing imaginary muscular work if hypnosis is induced between the two phases. Check your computation in (a) and (b) with the R commands below. Rest = c(5.74,6.79,5.32,7.18,5.60,6.06,6.32,6.34) Work = c(6.24,9.07,7.77,16.46,6.95,8.14,11.72,8.06) t.test (Work, Rest, paired = T) Check the plot(s) for the data in the treatment group. Do you see any outlier or severe skewness that make you concern about appropriateness of conducting the test and constructing the confidence interval in part (a) and (b)? Test whether hypnosis (treatment) induced a greater change in in total ventilation than no hypnosis (control). That is, test the hypotheses Họ: Htrt, work - Htrt, rest = Hetrl,work - Hetrl,rest Ha : Ptrt, work - Htrt, rest > Hetrl,work - Hctrl,rest where Hert, work-Htrt, rest is the mean change in total ventilation at work v.s. at rest for the hypnotized (treatment) group, and Hetri,work - Hctrl,rest is the corresponding change for the control group. Please report the test statistic with degrees of freedom, and give (a range for) the P-value. Did hypnosis induce a significantly higher change in total ventilation at 0.05 level? Hint: Should you conduct a two-sample t-test or a paired t-test?
In a study of hypnotic suggestion, 16 male volunteers were randomly allocated to a treatment group and a control group. Each subject participated in a two-phase experimental session. In the first phase, respiration was measured while the subject was awake and at rest. In the second phase, the subject was told to imagine that he was performing muscular work, and respiration was measured again. For subjects in the treatment group, hypnosis was induced between the first and second phases; thus, the suggestion to imagine muscular work was "hypnotic suggestion" for treatment subjects and "waking suggestion" for control subjects. The table below shows the measurements of total ventilation (liters of air per minute per square meter of body area) for all 16 subjects. Treatment Group Control Group Total Ventilation Difference Total Ventilation Difference Subject Rest Work Subject Rest Work (Work-Rest) (Work-Rest) 0.50 1 5.74 6.24 9 6.21 5.50 -0.71 6.79 9.07 2.28 10 4.50 4.64 0.14 3 5.32 7.77 2.45 11 4.86 4.61 -0.25 4 7.18 16.46 9.28 12 4.78 3.78 -1.00 5 5.60 6.95 1.35 13 4.79 5.41 0.62 6. 6.06 8.14 2.08 14 5.70 5.32 -0.38 7 6.32 11.72 5.40 15 5.41 4.54 -0.87 8 6.34 8.06 1.72 16 6.08 5.98 -0.10 Mean 6.16875 9.30125 3.1325 Mean 5.29125 4.9725 -0.31875 SD 0.62109 3.32276 2.8620 SD 0.65160 0.7027 0.54368 For those being hypnotized (treatment group), test the hypotheses Ho: Hrest = Hwork versus Ha: Hrest # Hwork, where µrest and Hwork are respectively the mean total ventilation when they are at rest and when they are performing imaginary muscular work. Please report the test statistic with degrees of freedom, and (a range for) the P-value. What do you conclude at 0.05 significance level? Construct a 95% confidence interval for the mean difference Hwork - Hrest in their total ventilation when the subjects are at rest and when performing imaginary muscular work if hypnosis is induced between the two phases. Check your computation in (a) and (b) with the R commands below. Rest = c(5.74,6.79,5.32,7.18,5.60,6.06,6.32,6.34) Work = c(6.24,9.07,7.77,16.46,6.95,8.14,11.72,8.06) t.test (Work, Rest, paired = T) Check the plot(s) for the data in the treatment group. Do you see any outlier or severe skewness that make you concern about appropriateness of conducting the test and constructing the confidence interval in part (a) and (b)? Test whether hypnosis (treatment) induced a greater change in in total ventilation than no hypnosis (control). That is, test the hypotheses Họ: Htrt, work - Htrt, rest = Hetrl,work - Hetrl,rest Ha : Ptrt, work - Htrt, rest > Hetrl,work - Hctrl,rest where Hert, work-Htrt, rest is the mean change in total ventilation at work v.s. at rest for the hypnotized (treatment) group, and Hetri,work - Hctrl,rest is the corresponding change for the control group. Please report the test statistic with degrees of freedom, and give (a range for) the P-value. Did hypnosis induce a significantly higher change in total ventilation at 0.05 level? Hint: Should you conduct a two-sample t-test or a paired t-test?

Linear Algebra: A Modern Introduction
4th Edition
ISBN:9781285463247
Author:David Poole
Publisher:David Poole
Chapter2: Systems Of Linear Equations
Section2.4: Applications
Problem 1EQ: 1. Suppose that, in Example 2.27, 400 units of food A, 600 units of B, and 600 units of C are placed...

Related questions
Question
Transcribed Image Text:2. In a study of hypnotic suggestion, 16 male volunteers were randomly allocated to a treatment group
and a control group. Each subject participated in a two-phase experimental session. In the first phase,
respiration was measured while the subject was awake and at rest. In the second phase, the subject was
told to imagine that he was performing muscular work, and respiration was measured again. For subjects
in the treatment group, hypnosis was induced between the first and second phases; thus, the suggestion
to imagine muscular work was "hypnotic suggestion" for treatment subjects and "waking suggestion" for
control subjects. The table below shows the measurements of total ventilation (liters of air per minute
per square meter of body area) for all 16 subjects.
Treatment Group
Total Ventilation
Work
Control Group
Difference
Total Ventilation Difference
Work
Subject
1
Rest
(Work-Rest)
Subject
Rest
(Work-Rest)
5.74
6.24
0.50
9.
6.21
5.50
-0.71
6.79
9.07
2.28
10
4.50
4.64
0.14
3
5.32
7.77
2.45
11
4.86
4.61
-0.25
4
7.18
16.46
9.28
12
4.78
3.78
-1.00
5
5.60
6.95
1.35
13
4.79
5.41
0.62
6
6.06
8.14
2.08
14
5.70
5.32
-0.38
7
6.32
11.72
5.40
15
5.41
4.54
-0.87
8
6.34
8.06
1.72
16
6.08
5.98
-0.10
Мean
6.16875 9.30125
3.1325
Mean
5.29125 4.9725
-0.31875
SD
0.62109 3.32276
2.8620
SD
0.65160 0.7027
0.54368
For those being hypnotized (treatment group), test the hypotheses Ho: Hrest = Hwork versus Ha:
Hrest # Hwork, where µrest and µwork are respectively the mean total ventilation when they are at
rest and when they are performing imaginary muscular work. Please report the test statistic with
degrees of freedom, and (a range for) the P-value. What do you conclude at 0.05 significance level?
Construct a 95% confidence interval for the mean difference Hwork - Hrest in their total ventilation
when the subjects are at rest and when performing imaginary muscular work if hypnosis is induced
between the two phases.
Check your computation in (a) and (b) with the R commands below.
Rest = c(5.74,6.79,5.32,7.18,5.60,6.06,6.32,6.34)
Work = c(6.24,9.07,7.77,16.46,6.95,8.14,11.72,8.06)
t.test (Work, Rest, paired = T)
Check the plot(s) for the data in the treatment group. Do you see any outlier or severe skewness
that make you concern about appropriateness of conducting the test and constructing the confidence
interval in part (a) and (b)?
2
Test whether hypnosis (treatment) induced a greater change in in total ventilation than no hypnosis
(control). That is, test the hypotheses
Ho : Htrt, work -
Htrt, rest = Hetrl, work - Hetrl,rest
Ha : Prt, work - Htrt, rest > fetrl,work - Hetrl,rest
where urt, work- Htrt, rest is the mean change in total ventilation at work v.s. at rest for the hypnotized
(treatment) group, and µetrl,work – Hetrl,rest is the corresponding change for the control group. Please
report the test statistic with degrees of freedom, and give (a range for) the P-value. Did hypnosis
induce a significantly higher change in total ventilation at 0.05 level? Hint: Should you conduct a
two-sample t-test or a paired t-test?
Expert Solution
This question has been solved!
Explore an expertly crafted, step-by-step solution for a thorough understanding of key concepts.

This is a popular solution!

Trending now
This is a popular solution!

Step by step
Solved in 5 steps with 3 images

Recommended textbooks for you
Linear Algebra: A Modern Introduction
Algebra
ISBN:
9781285463247
Author:
David Poole
Publisher:
Cengage Learning
Linear Algebra: A Modern Introduction
Algebra
ISBN:
9781285463247
Author:
David Poole
Publisher:
Cengage Learning