. As the owner of Barney’s Broilers—a fast-food chain—you see an increase in the demand for broiled chicken as consumers become more health conscious and reduce their consumption of beef and fried foods. As a result, you believe it is necessary to purchase another oven to meet the increased demand. To finance the oven you go to the bank seeking a loan. The loan officer tells you that your revenues of $750,000 are insufficient to support additional debt. To qualify for the loan, Barney’s Broilers’s revenue would need to be $50,000 higher. In developing a strategy to generate the additional revenue, you collect data on the price (in cents) per pound you charge customers and the related quantity of chicken consumed per year in pounds. This information is contained in the file called Q18.xls available online at www.mhhe.com/baye8e It is also available in the ‘Assignments’ section of the class Blackboard page in ‘MBA 6150 HW 3 Q18 data set’ file. Use that data and a log-linear demand specification to obtain least squares estimates of demand for broiled chicken. Write an equation that summarizes the demand for broiled chicken, and then determine the percentage price increase or decrease that is needed in order to boost revenues by $50,000

ENGR.ECONOMIC ANALYSIS
14th Edition
ISBN:9780190931919
Author:NEWNAN
Publisher:NEWNAN
Chapter1: Making Economics Decisions
Section: Chapter Questions
Problem 1QTC
icon
Related questions
Question

. As the owner of Barney’s Broilers—a fast-food chain—you see an increase in the demand for broiled chicken as consumers become more health conscious and reduce their consumption of beef and fried foods. As a result, you believe it is necessary to purchase another oven to meet the increased demand. To finance the oven you go to the bank seeking a loan. The loan officer tells you that your revenues of $750,000 are insufficient to support additional debt. To qualify for the loan, Barney’s Broilers’s revenue would need to be $50,000 higher. In developing a strategy to generate the additional revenue, you collect data on the price (in cents) per pound you charge customers and the related quantity of chicken consumed per year in pounds. This information is contained in the file called Q18.xls available online at www.mhhe.com/baye8e It is also available in the ‘Assignments’ section of the class Blackboard page in ‘MBA 6150 HW 3 Q18 data set’ file. Use that data and a log-linear demand specification to obtain least squares estimates of demand for broiled chicken. Write an equation that summarizes the demand for broiled chicken, and then determine the percentage price increase or decrease that is needed in order to boost revenues by $50,000


Excel
File
Edit
View
Insert
Format
Tools
Data
Window
Help
Wed Feb 24 6:50 PM
AutoSave
9 HW 3 data Q18.xls - Compatibility Mode
OFF
Home
Insert
Draw
Page Layout
Formulas
Data
Review
View
O Tell me
Share
Comments
ab
Conditional Formatting v
Insert v
Times New Roman
12
General
d Items
V
Format as Table v
Delete v
в I U
A v
Sort &
Filter
Sensitivity
Paste
2$
.00
.00 0
Find &
Select
Ideas
Cell Styles v
Format v
P18
v fx
A
B
C
D
E
F
G
H
J
K
M
N
Q
R
S
T
U
V
1 In (Quantity In (Price)
Shot
8.36 PM
0.85
2.38
Note: The data is already in
2
0.95
2.36
log form, so simply run a
linear regression where the
Y variable is In Q and the
3
4
1.04
2.34
5
1.08
2.33
6
1.15
2.28
7
1.18
2.30
1.20
2.23
8
9
1.23
2.20
10
1.30
2.18
11
1.32
2.12
12
1.34
2.11
13
1.36
2.08
14
1.36
2.11
15
1.40
2.09
16
1.38
2.04
17
1.45
2.05
18
1.48
2.08
19
1.48
2.04
1.49
2.04
21
1.52
2.04
22
1.56
2.00
23
1.56
1.99
24
1.57
2.00
1.56
2.11
25
Broiler Data
+
cy Terms
100%
FEB
CC
étv N A A O
W
24
XLS
make on error2 Exnlnin
>
WEO
P.
團
20
Transcribed Image Text:Excel File Edit View Insert Format Tools Data Window Help Wed Feb 24 6:50 PM AutoSave 9 HW 3 data Q18.xls - Compatibility Mode OFF Home Insert Draw Page Layout Formulas Data Review View O Tell me Share Comments ab Conditional Formatting v Insert v Times New Roman 12 General d Items V Format as Table v Delete v в I U A v Sort & Filter Sensitivity Paste 2$ .00 .00 0 Find & Select Ideas Cell Styles v Format v P18 v fx A B C D E F G H J K M N Q R S T U V 1 In (Quantity In (Price) Shot 8.36 PM 0.85 2.38 Note: The data is already in 2 0.95 2.36 log form, so simply run a linear regression where the Y variable is In Q and the 3 4 1.04 2.34 5 1.08 2.33 6 1.15 2.28 7 1.18 2.30 1.20 2.23 8 9 1.23 2.20 10 1.30 2.18 11 1.32 2.12 12 1.34 2.11 13 1.36 2.08 14 1.36 2.11 15 1.40 2.09 16 1.38 2.04 17 1.45 2.05 18 1.48 2.08 19 1.48 2.04 1.49 2.04 21 1.52 2.04 22 1.56 2.00 23 1.56 1.99 24 1.57 2.00 1.56 2.11 25 Broiler Data + cy Terms 100% FEB CC étv N A A O W 24 XLS make on error2 Exnlnin > WEO P. 團 20
Excel
File
Edit
View
Insert
Format
Tools
Data
Window
Help
Wed Feb 24 6:50 PM
AutoSave
9 HW 3 data Q18.xls - Compatibility Mode
OFF
Home
Insert
Draw
Page Layout
Formulas
Data
Review
View
O Tell me
Share
Comments
ab
Conditional Formatting v
Insert v
Σ
Times New Roman
12
General
d Items
V
Format as Table v
Delete v
В I U
A v
Sort &
Filter
Sensitivity
Paste
2$
.00
.00 0
Find &
Select
Ideas
Cell Styles v
Format v
P18
x v fx
▼
A
B
C
D
E
F
G
H
J
K
N
P
Q
R
S
T
U
V
Shot
23
1.56
1.99
8.36 PM
24
1.57
2.00
25
1.56
2.11
26
1.56
2.04
27
1.56
2.05
Shot
28
1.58
2.00
0.09 PM
29
1.59
1.95
30
1.62
1.96
31
1.66
1.95
32
1.65
1.93
33
1.67
1.88
34
1.68
1.85
35
1.69
1.83
36
1.72
1.85
37
1.74
1.78
38
1.75
1.83
39
1.77
1.78
40
1.79
1.81
41
1.82
1.82
42
1.84
1.78
43
44
45
46
47
48
Broiler Data
+
су- Тerms
100%
FEB
CC
étv N M A
W
24
XLS
make on error2 Exnlnin
>
Transcribed Image Text:Excel File Edit View Insert Format Tools Data Window Help Wed Feb 24 6:50 PM AutoSave 9 HW 3 data Q18.xls - Compatibility Mode OFF Home Insert Draw Page Layout Formulas Data Review View O Tell me Share Comments ab Conditional Formatting v Insert v Σ Times New Roman 12 General d Items V Format as Table v Delete v В I U A v Sort & Filter Sensitivity Paste 2$ .00 .00 0 Find & Select Ideas Cell Styles v Format v P18 x v fx ▼ A B C D E F G H J K N P Q R S T U V Shot 23 1.56 1.99 8.36 PM 24 1.57 2.00 25 1.56 2.11 26 1.56 2.04 27 1.56 2.05 Shot 28 1.58 2.00 0.09 PM 29 1.59 1.95 30 1.62 1.96 31 1.66 1.95 32 1.65 1.93 33 1.67 1.88 34 1.68 1.85 35 1.69 1.83 36 1.72 1.85 37 1.74 1.78 38 1.75 1.83 39 1.77 1.78 40 1.79 1.81 41 1.82 1.82 42 1.84 1.78 43 44 45 46 47 48 Broiler Data + су- Тerms 100% FEB CC étv N M A W 24 XLS make on error2 Exnlnin >
Expert Solution
Step 1

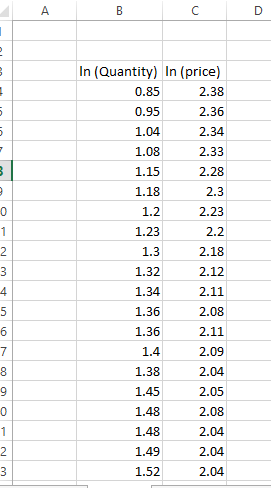
The regression equation can be determined in excel as follows:

Step 1: Put the data onto the spreadsheet 

Operations Management homework question answer, step 1, image 1


trending now

Trending now

This is a popular solution!

steps

Step by step

Solved in 2 steps with 4 images

Blurred answer
Knowledge Booster
Financing
Learn more about
Need a deep-dive on the concept behind this application? Look no further. Learn more about this topic, economics and related others by exploring similar questions and additional content below.
Similar questions
  • SEE MORE QUESTIONS
Recommended textbooks for you
ENGR.ECONOMIC ANALYSIS
Economics
ISBN:
9780190931919
Author:
NEWNAN
Publisher:
Oxford University Press
Principles of Economics (12th Edition)
Economics
ISBN:
9780134078779
Author:
Karl E. Case, Ray C. Fair, Sharon E. Oster
Publisher:
PEARSON
Engineering Economy (17th Edition)
Economics
ISBN:
9780134870069
Author:
William G. Sullivan, Elin M. Wicks, C. Patrick Koelling
Publisher:
PEARSON
Principles of Economics (MindTap Course List)
Economics
ISBN:
9781305585126
Author:
N. Gregory Mankiw
Publisher:
Cengage Learning
Managerial Economics: A Problem Solving Approach
Economics
ISBN:
9781337106665
Author:
Luke M. Froeb, Brian T. McCann, Michael R. Ward, Mike Shor
Publisher:
Cengage Learning
Managerial Economics & Business Strategy (Mcgraw-…
Economics
ISBN:
9781259290619
Author:
Michael Baye, Jeff Prince
Publisher:
McGraw-Hill Education