. At a local ice-cream store, 210 people were surveyed on whether they preferred eating ice cream from a cone or a cup. Of the 210 people surveyed, 70 were adults and 140 were children. Of the responses, 150 indicated the cone as the preferred method of eating ice cream. For those surveyed, there was no association between age and preferred method of eating ice cream. Which of the following tables shows the distribution of responses? (A) Cup Adults Children Total Cone 35 115 150 35 25 60 Total 70 140 210 (B) Cup 30 30 60 Cone Total Adults Children Total 40 70 110 150 140 210 Cone Cup Total Adults Children Total 50 20 70 100 40 140 150 60 210 (D) Cone 60 Adults 90 Children Total 150 Cup 10 50 60 Total 70 140 210 (E) Cone Cup 5 Total Adults 65 70 Children 85 55 60 140 Total 150 210
. At a local ice-cream store, 210 people were surveyed on whether they preferred eating ice cream from a cone or a cup. Of the 210 people surveyed, 70 were adults and 140 were children. Of the responses, 150 indicated the cone as the preferred method of eating ice cream. For those surveyed, there was no association between age and preferred method of eating ice cream. Which of the following tables shows the distribution of responses? (A) Cup Adults Children Total Cone 35 115 150 35 25 60 Total 70 140 210 (B) Cup 30 30 60 Cone Total Adults Children Total 40 70 110 150 140 210 Cone Cup Total Adults Children Total 50 20 70 100 40 140 150 60 210 (D) Cone 60 Adults 90 Children Total 150 Cup 10 50 60 Total 70 140 210 (E) Cone Cup 5 Total Adults 65 70 Children 85 55 60 140 Total 150 210

Big Ideas Math A Bridge To Success Algebra 1: Student Edition 2015
1st Edition
ISBN:9781680331141
Author:HOUGHTON MIFFLIN HARCOURT
Publisher:HOUGHTON MIFFLIN HARCOURT
Chapter11: Data Analysis And Displays
Section: Chapter Questions
Problem 1CA

Related questions
Question
Transcribed Image Text:下午1:20 4月20日周三
7 62%
...
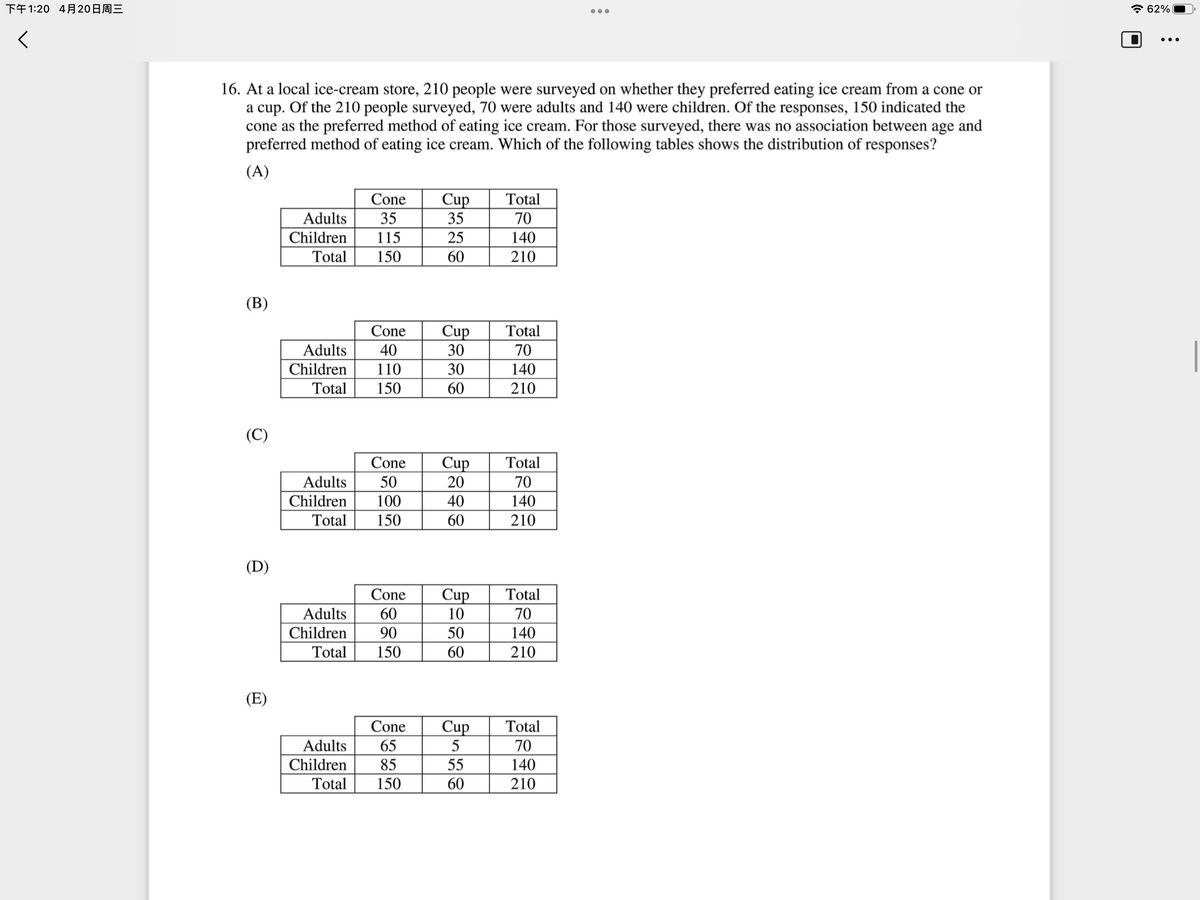
16. At a local ice-cream store, 210 people were surveyed on whether they preferred eating ice cream from a cone or
a cup. Of the 210 people surveyed, 70 were adults and 140 were children. Of the responses, 150 indicated the
cone as the preferred method of eating ice cream. For those surveyed, there was no association between age and
preferred method of eating ice cream. Which of the following tables shows the distribution of responses?
(A)
Cone
Total
Cup
35
Adults
35
70
Children
115
25
140
Total
150
60
210
(В)
Cone
Cup
Total
Adults
40
30
70
Children
110
30
140
Total
150
60
210
(C)
Cup
20
Cone
Total
Adults
50
70
Children
100
40
140
Total
150
60
210
(D)
Cone
Cup
Total
Adults
60
10
70
Children
90
50
140
Total
150
60
210
(E)
Cone
Cup
Total
Adults
65
70
Children
85
55
140
Total
150
60
210
Expert Solution
This question has been solved!
Explore an expertly crafted, step-by-step solution for a thorough understanding of key concepts.

This is a popular solution!

Trending now
This is a popular solution!

Step by step
Solved in 2 steps

Recommended textbooks for you
Big Ideas Math A Bridge To Success Algebra 1: Stu…
Algebra
ISBN:
9781680331141
Author:
HOUGHTON MIFFLIN HARCOURT
Publisher:
Houghton Mifflin Harcourt

Glencoe Algebra 1, Student Edition, 9780079039897…
Algebra
ISBN:
9780079039897
Author:
Carter
Publisher:
McGraw Hill
Big Ideas Math A Bridge To Success Algebra 1: Stu…
Algebra
ISBN:
9781680331141
Author:
HOUGHTON MIFFLIN HARCOURT
Publisher:
Houghton Mifflin Harcourt
Glencoe Algebra 1, Student Edition, 9780079039897…
Algebra
ISBN:
9780079039897
Author:
Carter
Publisher:
McGraw Hill