A survey was conducted of two types of marketers. The first type being marketers that focus primarily on attracting business (B2B), and the second type being marketers that primarily target consumers (B2C). It was reported that 518 (88%) of B2B and 250 (61%) of B2C marketers commonly use a business social media tool. The study also revealed that 313 (53%) of B2B marketers and 243 (60%) of B2C marketers commonly use a video social media tool. Suppose the survey was based on 589 B2B marketers and 407 B2C marketers. Complete parts (a) through (c) below. Find the rejection region. Select the correct choice below and fill in the answer box(es) to complete your choice. (Round to three decimal places as needed.) O A. ZSTAT O B. ZSTAT - 1.960 or ZSTAT>+ 1.960 Oc. ZSTAT> + Determine a conclusion. V the null hypothesis. There V of a difference between B2B marketers and B2C marketers in the proportion of the business social media tool. b. Find the p-value in (a) and interpret its meaning. p-value = (Type an integer or a decimal. Round to three decimal places as needed.) Interpret the p-value. If the proportion of B2B marketers that use the business social media tool V the proportion B2C marketers that use the business social media tool, the probability that a ZSTAT test statistic V the one calculated is approximately equal to the p-value.
A survey was conducted of two types of marketers. The first type being marketers that focus primarily on attracting business (B2B), and the second type being marketers that primarily target consumers (B2C). It was reported that 518 (88%) of B2B and 250 (61%) of B2C marketers commonly use a business social media tool. The study also revealed that 313 (53%) of B2B marketers and 243 (60%) of B2C marketers commonly use a video social media tool. Suppose the survey was based on 589 B2B marketers and 407 B2C marketers. Complete parts (a) through (c) below. Find the rejection region. Select the correct choice below and fill in the answer box(es) to complete your choice. (Round to three decimal places as needed.) O A. ZSTAT O B. ZSTAT - 1.960 or ZSTAT>+ 1.960 Oc. ZSTAT> + Determine a conclusion. V the null hypothesis. There V of a difference between B2B marketers and B2C marketers in the proportion of the business social media tool. b. Find the p-value in (a) and interpret its meaning. p-value = (Type an integer or a decimal. Round to three decimal places as needed.) Interpret the p-value. If the proportion of B2B marketers that use the business social media tool V the proportion B2C marketers that use the business social media tool, the probability that a ZSTAT test statistic V the one calculated is approximately equal to the p-value.

Glencoe Algebra 1, Student Edition, 9780079039897, 0079039898, 2018
18th Edition
ISBN:9780079039897
Author:Carter
Publisher:Carter
Chapter10: Statistics
Section10.6: Summarizing Categorical Data
Problem 28PPS

Related questions
Question
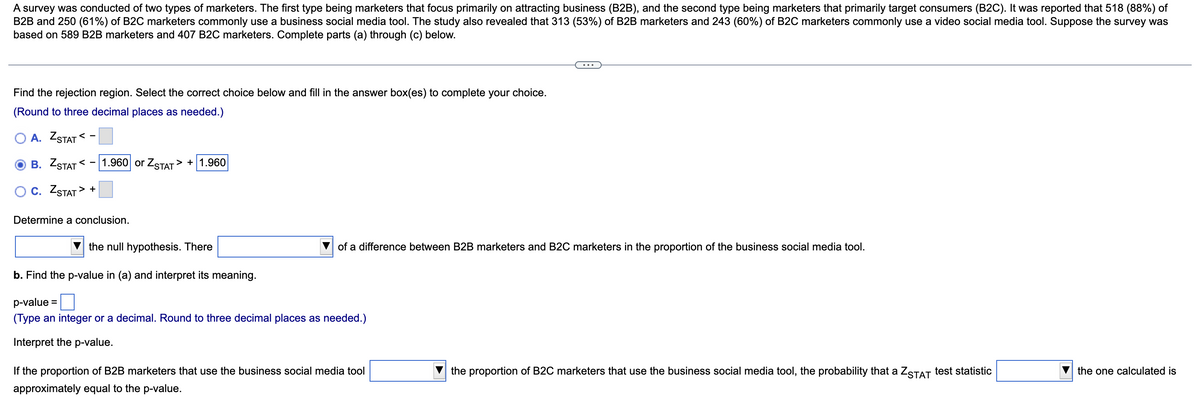
Transcribed Image Text:A survey was conducted of two types of marketers. The first type being marketers that focus primarily on attracting business (B2B), and the second type being marketers that primarily target consumers (B2C). It was reported that 518 (88%) of
B2B and 250 (61%) of B2C marketers commonly use a business social media tool. The study also revealed that 313 (53%) of B2B marketers and 243 (60%) of B2C marketers commonly use a video social media tool. Suppose the survey was
based on 589 B2B marketers and 407 B2C marketers. Complete parts (a) through (c) below.
Find the rejection region. Select the correct choice below and fill in the answer box(es) to complete your choice.
(Round to three decimal places as needed.)
O A. ZSTAT < -
В. ZSTAT <
1.960 or ZSTAT > + 1.960
Oc. ZSTAT > +
Determine a conclusion.
the null hypothesis. There
of a difference between B2B marketers and B2C marketers in the proportion of the business social media tool.
b. Find the p-value in (a) and interpret its meaning.
p-value =
(Type an integer or a decimal. Round to three decimal places as needed.)
Interpret the p-value.
If the proportion of B2B marketers that use the business social media tool
the proportion of B2C marketers that use the business social media tool, the probability that a ZSTAT test statistic
the one calculated is
approximately equal to the p-value.
Expert Solution
This question has been solved!
Explore an expertly crafted, step-by-step solution for a thorough understanding of key concepts.

This is a popular solution!

Trending now
This is a popular solution!

Step by step
Solved in 4 steps

Recommended textbooks for you
Glencoe Algebra 1, Student Edition, 9780079039897…
Algebra
ISBN:
9780079039897
Author:
Carter
Publisher:
McGraw Hill

Holt Mcdougal Larson Pre-algebra: Student Edition…
Algebra
ISBN:
9780547587776
Author:
HOLT MCDOUGAL
Publisher:
HOLT MCDOUGAL
Glencoe Algebra 1, Student Edition, 9780079039897…
Algebra
ISBN:
9780079039897
Author:
Carter
Publisher:
McGraw Hill
Holt Mcdougal Larson Pre-algebra: Student Edition…
Algebra
ISBN:
9780547587776
Author:
HOLT MCDOUGAL
Publisher:
HOLT MCDOUGAL