. Identify the data set's level of measurement. a. Hair color of women on a high school tennis team. b. ages of students in a statistics class c. number of milligrams of tar in 28 cigarettes
. Identify the data set's level of measurement. a. Hair color of women on a high school tennis team. b. ages of students in a statistics class c. number of milligrams of tar in 28 cigarettes

Glencoe Algebra 1, Student Edition, 9780079039897, 0079039898, 2018
18th Edition
ISBN:9780079039897
Author:Carter
Publisher:Carter
Chapter10: Statistics
Section10.5: Comparing Sets Of Data
Problem 26PFA

Related questions
Question
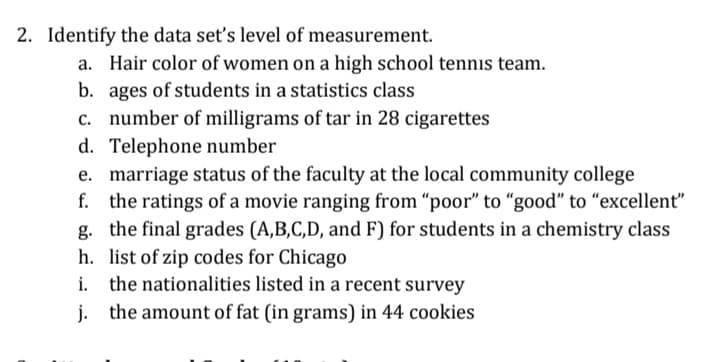
Transcribed Image Text:2. Identify the data set's level of measurement.
a. Hair color of women on a high school tennis team.
b. ages of students in a statistics class
c. number of milligrams of tar in 28 cigarettes
d. Telephone number
e. marriage status of the faculty at the local community college
f. the ratings of a movie ranging from "poor" to "good" to "excellent"
g. the final grades (A,B,C,D, and F) for students in a chemistry class
h. list of zip codes for Chicago
i. the nationalities listed in a recent survey
j. the amount of fat (in grams) in 44 cookies
Expert Solution
This question has been solved!
Explore an expertly crafted, step-by-step solution for a thorough understanding of key concepts.

This is a popular solution!

Trending now
This is a popular solution!

Step by step
Solved in 2 steps

Recommended textbooks for you
Glencoe Algebra 1, Student Edition, 9780079039897…
Algebra
ISBN:
9780079039897
Author:
Carter
Publisher:
McGraw Hill
Glencoe Algebra 1, Student Edition, 9780079039897…
Algebra
ISBN:
9780079039897
Author:
Carter
Publisher:
McGraw Hill