. Identify the test statistic test C. Identify the P-value for this hypothesis test D. If P-value is reject H0 or fail to reject H0?


Q: Which would be correct hypotheses for this test? Ho: AD = 0, H1:AD 0 OHo: HD =0, H1: µp #0 OHo: HD…
A: Since, you have posted a question with multiple sub-parts , we will solve the first three complete…
Q: A sample of 1400 items had 280 defective items. For the following hypothesis test, H0: p ≤ .20…
A: We have to find vakhe of test statistics.
Q: When the following hypotheses are being tested at a level of significance of a Ho: H2 100 H3: p Za/2…
A: A hypothesis which is tested for plausible rejection is called the Null Hypothesis (typically…
Q: For a Hypothesis Test, you have the following hypotheses: H0: p = 0.44 Ha: p ≠ 0.44 You have…
A: Given, H0: p = 0.44 Ha: p ≠ 0.44 Test Statistic of z = -2.42 P-value=?
Q: Which of the following is true about the p-value for this hypothesis test? p-value > 0.10 0.05 <…
A:
Q: What is the decision at a 0.05 level of significance for each of the following tests? F(3, 26) =…
A: From the provided information, Level of significance (α) = 0.05 F (3, 26) = 3.00 The critical value…
Q: Perform a one-sided hypothesis test to a 0.05 level of significance, to determine whether or nat the…
A:
Q: f. What is the p-value associated with the hypothesis test? O 0.110 O 0.181 0.015 O 0.013
A: It is given that, We want test the mean number of species in a logged forest plot is different to…
Q: Subiect Is achieving a basic skill level related to the location of the school? The results of a…
A: a) In this case, it is needed to check whether skill level and location are independent.
Q: What is the research hypothesis for the null hypothesis, H0: µ1 = 18.03
A: We have to find given hypothesis.
Q: Write the research and null hypothesis for the following researches: a. To test the differentiated…
A: Null and Alternative Hypothesis are the conditions which we test for in our hypothesis testing. In…
Q: 2. A researcher selects a sample of n = 20 from a normal population with p 80 and o = 20, and a…
A: We have given that, n = 20, μ= 80 and σ= 20
Q: In a one-tail hypothesis test where you reject H0 only in the upper tail, what is the p-value if…
A: Concept of p-value: The p-value in hypothesis testing is the probability of obtaining a test…
Q: The null and alternative hypotheses in statistical hypothesis testing are always statements aBoul. O…
A: The first step of hypothesis testing is writing down the hypotheses.
Q: When the p-value is used for hypothesis testing, the null hypothesis is rejected if O a. a a O d.…
A: The p-value is the prior probability that an observed test statistic is at least as extreme given…
Q: In a given hypothesis test, the null hypothesis cannot be rejected at the 0.005 and the 0.01 level…
A: P – value is the probability value, it calculated from the test statistic value and which is always…
Q: When the p-value is used for hypothesis testing, the null hypothesis is rejected if a O p-value = 1…
A: Given that the p-value is used for hypothesis testing.
Q: Given H 0: us 25 and H a: u> 25, determine whether the hypothesis test is left-tailed, right-tailed,…
A: Given, H0:µ≤25 Ha:µ>25
Q: When testing the hypothesized equality of two population means, the implied null hypothesis is…
A:
Q: Set up a hypothesis test so that the rejection of H, will allow you to conclude that the proportion…
A: Null and alternative hypotheses: Null hypothesis: Null hypothesis is a statement which is tested for…
Q: Which of the following is the correct null hypothesis for an independent-measures t test? Group of…
A: From the provided information, The test is independent measures t test.
Q: The P-value for a hypothesis test is shown. Use the P-value to decide whether to reject Ho when the…
A:
Q: For a Hypothesis Test, you have the following hypotheses: H0: p = 0.25 Ha: p > 0.25 You have…
A:
Q: In each part, we have given the significance level and the P-value for a hypothesis test. For each…
A:
Q: A statistics professor wants to see if more than 8o% of her students enjoyed her class. At the end…
A: There are two hypotheses null and alternative hypothesis, Null hypothesis = H0: The hypothesis says…
Q: 41. In statistical notation, which of the following is the correct null hypothesis for an…
A: We have given that, In statistical notation, which of the following is the correct null hypothesis…
Q: When the p-value is used for hypothesis testing, the null hypothesis is rejected if O a. p-value a
A: if p-value is less than a(level of significance ) then null hypothesis is rejected.
Q: The P-value for a hypothesis test is given. Determine whether the strength of the evidence against…
A:
Q: given the hypotheses H0 :S=S0, HA :S̸=S0, which are tested with a test statistic Y . When H0 is…
A: The hypothesis to be tested is: H0: S=S0 vs. Ha: S≠S0
Q: Which of the following statements about hypothesis testing is correct? o In hypothesis testing,…
A: Inferential statistics: It is the process making inference about population parameter using the…
Q: When the following hypotheses are being tested at a level of significance of a Ho: P2 100 Ha: H Za O…
A: Statistical hypothesis testing is an important method in inferential statistics. It is used to test…
Q: A survey was conducted that asked AHC (Population 1) students and Cuesta students if they dríve to…
A:
Q: When the following hypotheses are being tested at a level of significance of a Но: 2 100 Hạ: µ Za/2…
A: The null and alternate hypothesis are H0 :μ≥100HA :μ<100 The level of significance is "a" we…
Q: Q2. a) Discuss the methods to be used for hypothesis testing. b) Approximately 60% of all part-time…
A: Given: n=100 α=0.05
Q: For each of the following research excerpts in (a) – (c) , give the following information: (1) The…
A: Given: M=x¯=10SD=2.45t48=3.54p<0.05
Q: In each part, we have given the significance level and the P-value for a hypothesis test. For each…
A: Rejection rule: If the P-value is less than or equal to the level of significance then reject the…
Q: In testing the hypotheses H0: µ > 75 vs. HA: µ < 75, if the value of the test statistic z (z…
A: The given hypothesis is H0:μ≥75 vs.HA:μ<75. The test statistic z is -1.92. It is clear that the…
Q: If you use a 0.03 level of significance in a (two-tail) hypothesis test, what is your decision…
A: Given info: level of significance: α=0.03 Tail of the hypothesis test: two-tail Hypotheses: H0:…
Q: In each part, we have given the significance level and the P-value for a hypothesis test. For each…
A: Decision rule: If p-value ≤ α, then reject the null hypothesis. Otherwise, fail to reject the null…
Q: A sports enthusiast would like to determine if the average number of penalty minutes per game for…
A: Identify the correct hypotheses that need to be tested. The correct option is identified below: From…
Q: Which of the following null hypotheses is appropriate for an independent-measures t test? Ho Hi = 42…
A: For independent-measures t test, there are two samples. Null Hypothesis: There is no significant…
Q: B. Create two problems in testing hypothesis. Determine the given and formulate the null and…
A: Jeffrey, as an eight-year old, established a mean time of 16.43 seconds for swimming the 25-yard…
Q: Consider the following hypothesis test: Orl = il : "H H, : µ + 4o 4o is called Select one: O a. the…
A:
Q: The P-value for a hypothesis test is shown. Use the P-value to decide whether to reject Ho when the…
A: To decide whether to reject the null hypothesis we compare p-value and level of significance.
Q: State the null and alternative hypotheses for a hypothesis test; indicate whether the hypothesis…
A: Explanation: Null hypothesis is a statement about a population parameter, such as the population…
Q: The results of a hypothesis test are reported as follows in a scientific report: t(38) = -3.13, p <…
A: Given, t(38) = -3.13 , p < .05 The hypothesis to be tested is- H0: there is no difference between…
Q: ...... mich of the following is the hypothesis test to be conducted? B. Họ: p0.787 "C. Ho: p=0.787…
A: From the given information we have: population proportion, p= 0.787 sample size, n = 878…
Q: 6) The GPA for a SRS of CCC students is given below. 3.75 1.92 2.00 2.15 2.65 3.15 2.86 3.29 2.41…
A: Solution to test the claim that the GPA of all CCC students is different than 2.0 , first we need…
Q: P value < a/2, on a two-tailed hypothesis test would lead to rejecting H, O True O False
A: We have given that, P- value < α/2, on a two - tailed hypothesis test would lead to rejecting…
B. Identify the test statistic test
C. Identify the P-value for this hypothesis test
D. If P-value is reject H0 or fail to reject H0?

Step by step
Solved in 2 steps with 2 images

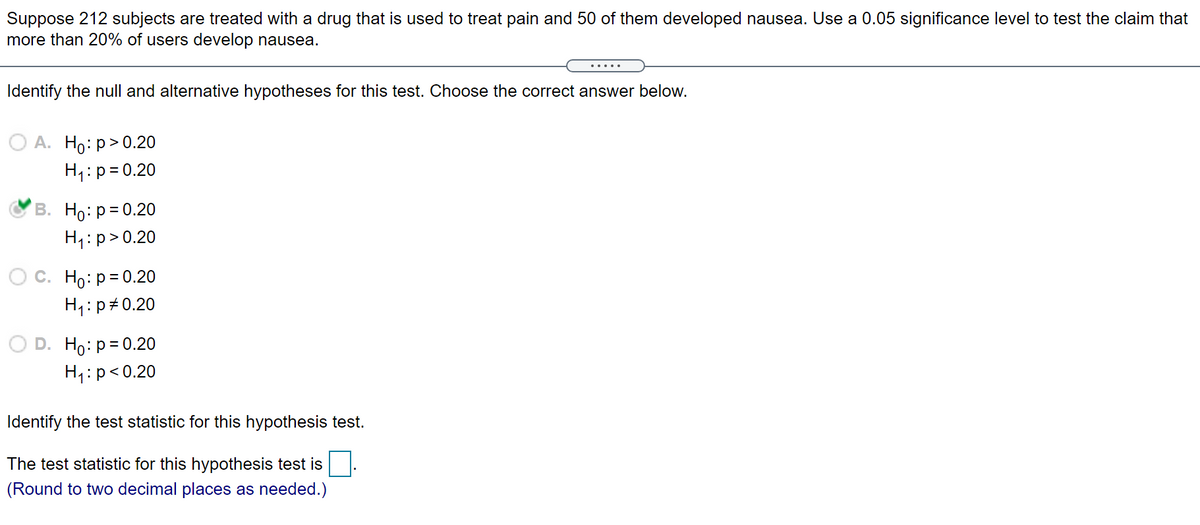
- Suppose 212 subjects are treated with a drug that is used to treat pain and 52 of them developed nausea. Use a 0.01 significance level to test the claim that more than 20% of users develop nausea. Identify the null and alternative hypotheses for this test. Choose the correct answer below. A. H0: p=0.20 H1: p<0.20 B. H0: p=0.20 H1: p>0.20 C. H0: p=0.20 H1: p≠0.20 D. H0: p>0.20 H1: p=0.20 Identify the test statistic for this hypothesis test. The test statistic for this hypothesis test is _____ (Round to two decimal places as needed.) Identify the P-value for this hypothesis test. The P-value for this hypothesis test is ____ (Round to three decimal places as needed.) Identify the conclusion for this hypothesis test. A. Fail to reject H0. There is sufficient evidence to warrant support of the claim that more than 20% of users develop nausea. B. Reject H0. There is not sufficient evidence to warrant support of the claim…Suppose 221 subjects are treated with a drug that is used to treat pain and 53 of them developed nausea. Use a 0.10 significance level to test the claim that more than 20% of users develop nausea.Identify the null and alternative hypotheses for this test. Choose the correct answer below.A. H0:p=0.20 H1 : p > 0.20B. H0:p=0.20 H1 : p ≠ 0.20C. H0:p=0.20 H1 : p < 0.20D. H0:p>0.20 H1 : p = 0.20Identify the test statistic for this hypothesis test.The test statistic for this hypothesis test is (Round to two decimal places as needed.)Identify the P-value for this hypothesis test.The P-value for this hypothesis test is (Round to three decimal places as needed.)Identify the conclusion for this hypothesis test...A. Reject H0. There is sufficient evidence to warrant support of the claim that more than 20% of users develop nausea.B. Fail to reject H0. There is not sufficient evidence to warrant support of the claim that more than 20% of users develop nausea.C. Reject H0. There is not…Suppose 227 subjects are treated with a drug that is used to treat pain and 54 of them developed nausea. Use a 0.10 significance level to test the claim that more than 20% of users develop nausea. Identify the null and alternative hypotheses for this test. Choose the correct answer below. A. H0: p=0.20 H1: p≠0.20 B. H0: p=0.20 H1: p<0.20 C. H0: p>0.20 H1: p=0.20 D. H0: p=0.20 H1: p>0.20 Identify the test statistic for this hypothesis test. The test statistic for this hypothesis test is- The p-value- REject ho?
- Suppose 234 subjects are treated with a drug that is used to treat pain and 53 of them developed nausea. Use a 0.10 significance level to test the claim that more than 20% of users develop nausea. Identify the null and alternative hypotheses for this test. Choose the correct answer below. A. H0: p=0.20 H1: p<0.20 B. H0: p=0.20 H1: p≠0.20 C. H0: p=0.20 H1: p>0.20 D. H0: p>0.20 H1: p=0.20 Identify the test statistic for this hypothesis test. The test statistic for this hypothesis test is 1.011.01. (Round to two decimal places as needed.) Identify the P-value for this hypothesis test. The P-value for this hypothesis test is enter your response here. (Round to three decimal places as needed.) Identify the conclusion for this hypothesis test. A. Reject H0. There is not sufficient evidence to warrant support of the claim that more than 20% of users develop nausea. B. Reject H0.…Suppose 213 subjects are treated with a drug that is used to treat pain and 50 of them developed nausea. Use a 0.01 significance level to test the claim that more than 20% of users develop nausea. Identify the null and alternative hypotheses for this test. Choose the correct answer below. A. H0: p=0.20 H1: p<0.20 B. H0: p=0.20 H1: p≠0.20 C. H0: p>0.20 H1: p=0.20 D. H0: p=0.20 H1: p>0.20 Identify the test statistic for this hypothesis test. The test statistic for this hypothesis test is nothing. (Round to two decimal places as needed.) Identify the P-value for this hypothesis test. The P-value for this hypothesis test is nothing. (Round to three decimal places as needed.) Identify the conclusion for this hypothesis test. A. Fail to reject H0. There is sufficient evidence to warrant support of the claim that more than 20% of users develop nausea. B. Reject H0. There is not…Suppose 230 subjects are treated with a drug that is used to treat pain and 52 of them developed nausea. Use a 0.10 significance level to test the claim that more than 20% of users develop nausea. Identify the null and alternative hypotheses for this test. Choose the correct answer below. A. H0:p=0.20 H1:p>0.20 B. H0:p=0.20H1: p≠0.20 C. H0:p=0.20 H1:p<0.20 D. H0:p>0.20 H1:p=0.20 Identify the test statistic for this hypothesis test. The test statistic for this hypothesis test is ___________ (Round to two decimal places as needed.) Identify the P-value for this hypothesis test. The P-value for this hypothesis test is ___________ (Round to three decimal places as needed.) Identify the conclusion for this hypothesis test.
- Suppose 203 subjects are treated with a drug that is used to treat pain and 54 of them developed nausea. Use a 0.10 significance level to test the claim that more than 20% of users develop nausea. Identify the null and alternative hypotheses for this test. Choose the correct answer below. A. H0: p=0.20 H1: p<0.20 B. H0: p>0.20 H1: p=0.20 C. H0: p=0.20 H1: p>0.20 D. H0: p=0.20 H1: p≠Suppose 203 subjects are treated with a drug that is used to treat pain and 54 of them developed nausea. Use a 0.10 significance level to test the claim that more than 20% of users develop nausea. Identify the null and alternative hypotheses for this test. Choose the correct answer below. A. H0: p=0.20 H1: p<0.20 B. H0: p>0.20 H1: p=0.20 C. H0: p=0.20 H1: p>0.20 Your answer is correct. D. H0: p=0.20 H1: p≠0.20 Identify the test statistic for this hypothesis test. The test statistic for this hypothesis test is 2.352.35. (Round to two decimal places as needed.) Identify the P-value for this hypothesis test. The P-value for this hypothesis test is enter your response here. (Round to three decimal places as needed.)Suppose 203 subjects are treated with a drug that is used to treat pain and 54 of them developed nausea. Use a 0.10 significance level to test the claim that more than 20% of users develop nausea. Identify the null and alternative hypotheses for this test. Choose the correct answer below. A. H0: p=0.20 H1: p<0.20 B. H0: p>0.20 H1: p=0.20 C. H0: p=0.20 H1: p>0.20 Your answer is correct. D. H0: p=0.20 H1: p≠0.20 Identify the test statistic for this hypothesis test. The test statistic for this hypothesis test is enter your response here. (Round to two decimal places as needed.)
- In a previous Paul, 44% of adults with children under the age of 18 reported that their family ate dinner together seven nights a week. Suppose that, in a more recent poll, 547 of 1300 adults with children under the age of 18 reported that their family ate dinner together seven nights a week. Is their significance evidence that the proportion of families with children under the age of 18 who eat dinner together seven nights a week has decreased at the = 0.05 significance level? what are the Null and alternative hypothesis?develop a research question that can be addressed with the dependent-samples t test, making sure to state the null and alternative hypotheses (in words)Suppose 233subjects are treated with a drug that is used to treat pain and 50 of them developed nausea. Use a 0.05 significance level to test the claim that more than 20% of users develop nausea. Identify the null and alternative hypotheses for this test. Choose the correct answer below. A. H0: p=0.20 H1: p≠0.20 B. H0: p=0.20 H1: p>0.20 C. H0: p>0.20 H1: p=0.20 D. H0: p=0.20 H1: p<0.20 Identify the test statistic for this hypothesis test. The test statistic for this hypothesis test is (Round to two decimal places as needed.) Identify the P-value for this hypothesis test. The P-value for this hypothesis test is (Round to three decimal places as needed.) Identify the conclusion for this hypothesis test. A. Reject H0. There is sufficient evidence to warrant support of the claim that more than 20% of users develop nausea. B. Fail to reject H0. There is sufficient evidence to warrant…


