
Nutritional Sciences: From Fundamentals to Food, Enhanced Edition
3rd Edition
ISBN:9781337486415
Author:McGuire
Publisher:McGuire
Chapter2: Nutritional Assessment And Dietary Planning
Section: Chapter Questions
Problem II4DWPA

Related questions

Question
See attached, you have a table that is perhaps required for some of the questions.
Answer question number 3 in your own words. Do not copy and paste from google.
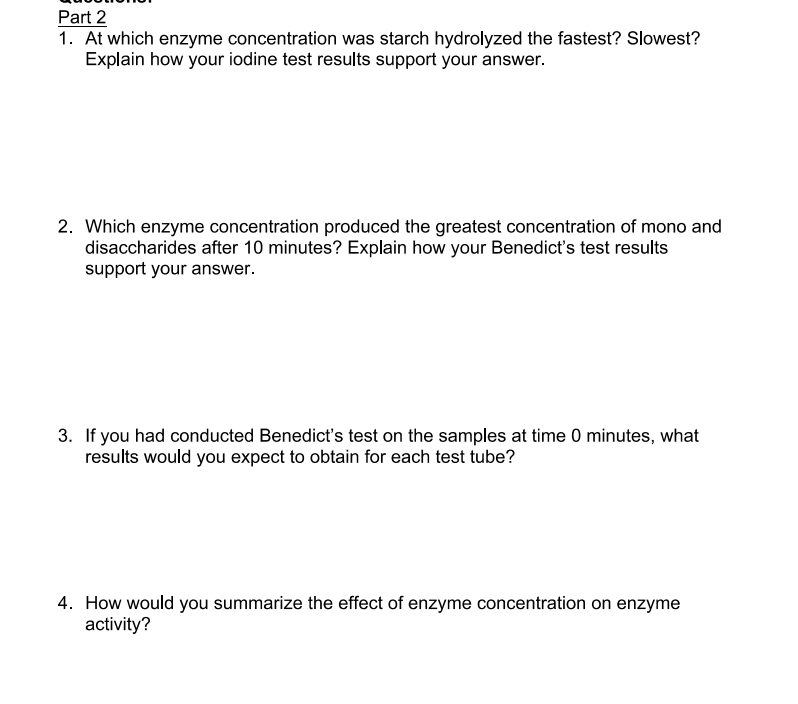
Transcribed Image Text:Part 2
1. At which enzyme concentration was starch hydrolyzed the fastest? Slowest?
Explain how your iodine test results support your answer.
2. Which enzyme concentration produced the greatest concentration of mono and
disaccharides after 10 minutes? Explain how your Benedict's test results
support your answer.
3. If you had conducted Benedict's test on the samples at time 0 minutes, what
results would you expect to obtain for each test tube?
4. How would you summarize the effect of enzyme concentration on enzyme
activity?
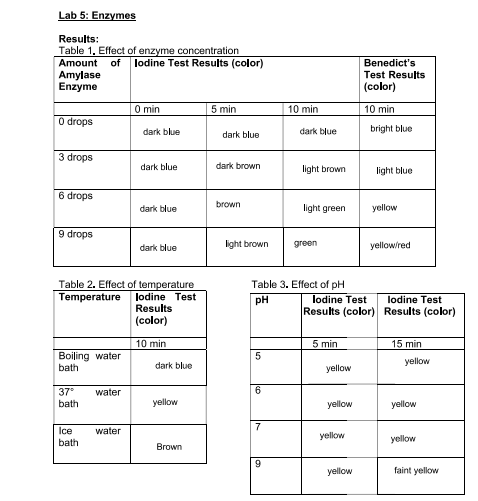
Transcribed Image Text:Lab 5: Enzymes
Results:
Table 1, Effect of enzyme concentration
Amount of lodine Test Results (color)
Amylase
Enzyme
0 drops
3 drops
6 drops
9 drops
Boiling water
bath
37° water
bath
Ice
bath
0 min
water
dark blue
Table 2. Effect of temperature
Temperature
dark blue
dark blue
dark blue
lodine Test
Results
(color)
10 min
dark blue
yellow
Brown
5 min
dark blue
dark brown
brown
light brown
5
6
7
10 min
9
dark blue
Table 3. Effect of pH
pH
light brown
light green
green
5 min
yellow
yellow
yellow
Benedict's
Test Results
(color)
lodine Test
Results (color)
yellow
10 min
bright blue
light blue
yellow
yellow/red
lodine Test
Results (color)
15 min
yellow
yellow
yellow
faint yellow
Expert Solution
This question has been solved!
Explore an expertly crafted, step-by-step solution for a thorough understanding of key concepts.

Step by step
Solved in 2 steps

Knowledge Booster


Learn more about
Need a deep-dive on the concept behind this application? Look no further. Learn more about this topic, biology and related others by exploring similar questions and additional content below.Recommended textbooks for you
Nutritional Sciences: From Fundamentals to Food, …
Health & Nutrition
ISBN:
9781337486415
Author:
McGuire
Publisher:
Cengage
Nutritional Sciences: From Fundamentals to Food, …
Health & Nutrition
ISBN:
9781337486415
Author:
McGuire
Publisher:
Cengage