. Solve P70 in the following distribution of scores and find the percentile rank of 42. CLASS INTERVAL f 25-29 30-34 35-39 40-44 45-49 50-54 55-59 60-64 65-69 70-74 75-79 80-84 325 5 8 00 00 00 6 8 8 9 6 6 mmm 3 3 3
Q: Suppose you run research about the relationship between the frequency of smoking and hours of sleep.…
A: Given: r=-0.63
Q: If all the correlation coefficients of zero order in a set of p variates are all equal to p, show…
A:
Q: Consider the following set of data: Commerce students (1) Science students (2) Sample Size 100 80…
A:
Q: Q3/ The median for the frequency distribution is 47 70 87 45 17 33 90 57 72 65 69 35 49 40 10 22 29…
A: Introduction: Median for the grouped frequency distribution: Median is also called as the second…
Q: 1.What is the critical F at the .05 level (4 decimal places)? 2.Is the addition of SOUTH and…
A:
Q: In a poll about work, 68% of respondents said that their jobs were sometimes or always stressful.…
A:
Q: 4.4 4) The quality control officer at Spaz Cola uses a systematic random sampling method to select…
A:
Q: The target thickness of aluminum sheets produced by a machine is 5 mm. A sample of 50 sheets is…
A: Given: Sample size, n=50Sample mean, x¯=0.46Sample sd, s=0.36α=0.05
Q: A certain printing press is known to turn out an average of 45 copies a minute. In an attempt to…
A:
Q: Best Subsets Regression: y versus x1, x2, x3 Response is y R-Sq Vars R-Sq (adj) PRESS 1 99.1 99.0…
A: Coefficient of determination (R2): It determines the variation explained by the independent variable…
Q: A "12 Oz" jar of a local brand of peanut is less than this value. The Better Business bureau…
A:
Q: Using the Bayesian Network shown below: P(A=true) A 0.4 A P(B=true|A) truc 0.2 false 0.4 B…
A: Given the Bayesian Network as PA=true 0.4 A PB=true/A true 0.2 false 0.4 B…
Q: Example. Find the cumulative frequency and CDF for observation 10.8 6.9 8.0 8.8 7.3 3.6 4.1 6.0 4.4…
A: 50 observations are provided. The least data value is 2.5 and largest value is 12.8.
Q: adult male passengers, find the probability that it is overloaded because they have a mean weight…
A: Given Data : Population Mean,μ = 167 Population Standard Deviation,σ = 26
Q: Using the first 15 respondents: (a) Create a cross-tab for any two variables you like. (You can…
A: Hi! Thank you for the question, As per the honor code, we are allowed to answer three sub-parts at a…
Q: 15. If x₁=Y1+ y2, X2 = y2 + Y3, x3 = y3+y₁, where y₁, y2 y3 are correlated variables each of which…
A:
Q: Suppose you want to compute the correlation between overspending behavior and gaming aggression. You…
A: Given Information: Given Variables=1. Overdpending behavior2. Gaming Aggression.r=-5.36
Q: Consider a binomial distribution. About 33% of math students attend a Math Lab during the semester.…
A:
Q: Find the coefficient of determination, r2. Explain what it means in the context of this problem.…
A: Since you have posted a question with multiple subparts, we will solve first three subparts for you.…
Q: As reported in Runner's World magazine, the times of the finishers in the New York Cit km run are…
A:
Q: A factory is located close to a city high school. The manager claims that the plant's smokestacks…
A: Given problem Given that From given , Mean = x̄ = 385 pounds Standard deviation = σ = 150…
Q: The following tasks are required to produce widgets. Task Time Immediate (seconds) Predecessor A 30…
A:
Q: In which class does the quartile 1 located?
A: Solution-: We have given the following table: Class No. Class Intervals Class Boundaries Lower…
Q: equations and hence find most plausible values of x and y from the following equations : x+y=3.01,…
A:
Q: 9. One of the important concepts in the special addition rule of probability is mutual exclusive…
A:
Q: 15. Find the missing frequency of the following distribution. The mean of the data is 28. Profits…
A:
Q: "According to Dietary Goals for the US (1977), high sodium intake may be related to ulcers, stomach…
A: The given information is Population mean : 220 milligramssample mean:x¯=210 milligramssample…
Q: 10. The figure shows the counts of earned degrees for several colleges. The level of degree and the…
A:
Q: Economics Consider the following in normal form: B S B 4,2 0,0 S 0,0 2,4 a. Is there a Nash…
A:
Q: . What is the answer in (2) in the coefficients table? (in 4 decimal answer)
A:
Q: (note: use mu for mean or average , p for proportion, >= for , <= for , =/ for ) State the null and…
A:
Q: Amstat News (December 2004) lists median salaries for associate professors of statistics at research…
A:
Q: 1. The table below shows the number of selfies posted online and the score obtained from Science…
A: Given that We have to conduct hypothesis testing for the claim that there is…
Q: Question 39 Normal Form Game: The table below provides a normal form, 2 x 2 game. The players are…
A: Given statement: Row player has dominant strategy.
Q: Use StatCrunch to determine the area under the standard normal density curve between -1.5 and 0.75.…
A:
Q: 1. A study was done before the recent surge in gasoline prices to compare the cost to drive 25 miles…
A:
Q: AT math scores are normally distributed with the parameters below. μ=500σ=100 What is the…
A: Given that The data is normally distributed Mean (μ) = 500 Standard deviation (σ) = 100 We know…
Q: Consider the following. n = 25 H0: μ ≤ 19 x̄ = 24.6 Ha: μ > 19 σ = 20 The p-value is _____.…
A:
Q: 1.Which is the alternative hypothesis? a. There is a significant difference between a person's age…
A:
Q: One-Sample Statistics N Mean 8 Std. Deviation Std. Error Mean 10.74377 3.79850 One-Sample Test…
A:
Q: tabase that are investor-owned for-profit. (Hint: In Control, 5 = investor-owned for-profit.) From…
A: Gov Fed Gov NonFed InvestorOwned For Profit NonGov Non Profit Other Nonprofit Grand Total 1…
Q: assume that you plan to use a significance level of. 05 to test the claim that P one equals P2 used…
A: From the given information we conduct the Hypothesis test for Proportion. We get one example for…
Q: What percentage of scores would be above 567?
A:
Q: With chi-squared tests, we always have ________-tailed tests with at least ______ expected…
A: Solution-: With chi-squared tests, we always have _______-tailed tests with at least _______expected…
Q: jared is opening several ice cream stores. The walls of the stores can be yellow or blue. He wants…
A: The correct choice of appropriate statistical model depends on satisfaction of different conditions.
Q: A student takes a multiple-choice test that has 8 questions. Each question has four choices. The…
A:
Q: 12. A bowl contains 3 blue and 5 red balls. Two balls are randomly drawn without replacement. a)…
A:
Q: A random sample of 14 cigarettes of a certain brand has an average nicotine content of 4.2…
A:
Q: In a poll about work, 68% of respondents said that their jobs were sometimes or always stressful.…
A: Given: Probability of respondents says job were stressful, p=0.68 Sample size, n=12
Q: 1.The test scores of Biostatistics examination follows a normal distribution with a mean of 60 and a…
A: As per bartleby guideline expert have to answer first question only dear student please upload other…
Subject: Engineering Data analysis
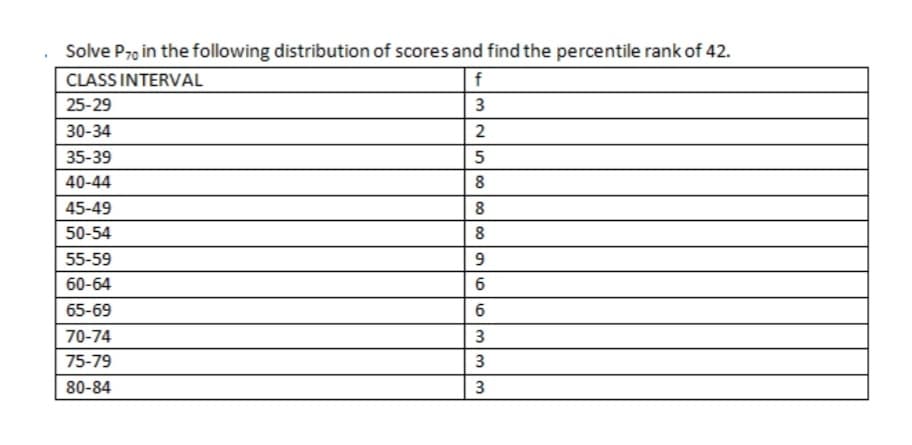
Trending now
This is a popular solution!
Step by step
Solved in 3 steps
- Use the following scenario for the exercises that follow: In the game of Keno, a player starts by selecting 20 numbers from the numbers 1 to 80. After the player makes his selections, 20 winning numbers are randomly selected from numbers 1 to 80. A win occurs if the player has correctly selected 3,4, or 5 of the 20 winning numbers. (Round all answers to the nearest hundredth of a percent.) 54. What is the percent chance of winning?Use the following scenario for the exercises that follow: In the game of Keno, a player starts by selecting 20 numbers from the numbers 1 to 80. After the player makes his selections, 20 winning numbers are randomly selected from numbers 1 to 80. A win occurs if the player has correctly selected 3,4, or 5 of the 20 winning numbers. (Round all answers to the nearest hundredth of a percent.) 53. What is the percent chance that a player selects all 5 winning numbers?Use the following scenario for the exercises that follow: In the game of Keno, a player starts by selecting 20 numbers from the numbers 1 to 80. After the player makes his selections, 20 winning numbers are randomly selected from numbers 1 to 80. A win occurs if the player has correctly selected 3,4, or 5 of the 20 winning numbers. (Round all answers to the nearest hundredth of a percent.) 55. How much less is a player’s chance of selecting 3 winning numbers than the chance of selecting either 4 or 5 winning numbers?
- Use the following scenario for the exercises that follow: In the game of Keno, a player starts by selecting 20 numbers from the numbers 1 to 80. After the player makes his selections, 20 winning numbers are randomly selected from numbers 1 to 80. A win occurs if the player has correctly selected 3,4, or 5 of the 20 winning numbers. (Round all answers to the nearest hundredth of a percent.) 51. What is the percent chance that a player selects exactly 3 winning numbers?Use this data for the exercises that follow: In 2013, there were roughly 317 million citizens in the United States, and about 40 million were elderly (aged 65 and over).[34] 59. If you meet five U.S. citizens, what is the percent chance that four are elderly? (Round to the nearest thousandth of a percent.)Use this data for the exercises that follow: In 2013, there were roughly 317 million citizens in the United States, and about 40 million were elderly (aged 65 and over).[34] 57. If you meet five U.S. citizens, what is the percent chance that exactly one is elderly? (Round to the nearest tenth of a percent.)
- Use this data for the exercises that follow: In 2013, there were roughly 317 million citizens in the United States, and about 40 million were elderly (aged 65 and over).[34] 56. If you meet a U.S. citizen, what is the percent chance that the person is elderly? (Round to the nearest tenth of a percent.)For the following exercises, use the following data: An elementary school survey found that 350 of the 500 students preferred soda to milk. Suppose 8 children from the school are attending a birthday party. (Show calculations and round to the nearest tenth of a percent.) 56. What is the percent chance that exactly 3 of the children attending the party prefer soda?For the following exercises, use the following data: An elementary school survey found that 350 of the 500 students preferred soda to milk. Suppose 8 children from the school are attending a birthday party. (Show calculations and round to the nearest tenth of a percent.) 55. What is the percent chance that at least one of the children attending the party prefers milk?
- For the following exercises, use the following data: An elementary school survey found that 350 of the 500 students preferred soda to milk. Suppose 8 children from the school are attending a birthday party. (Show calculations and round to the nearest tenth of a percent.) 57. What is the percent chance that exactly 3 of the children attending the party prefer milk?For the following exercises, use the following data: An elementary school survey found that 350 of the 500 students preferred soda to milk. Suppose 8 children from the school are attending a birthday party. (Show calculations and round to the nearest tenth of a percent.) 54. What is the percent chance that all the children attending the party prefer soda?For the following exercises, two dice are rolled, and the results are summed. 33. Construct a table showing the sample space of outcomes and sums.