Best Subsets Regression: y versus x1, x2, x3 Response is y R-Sq Vars R-Sq (adj) PRESS 1 99.1 99.0 341.1 78.0 76.8 8523.2 99.2 99.1 325.6 99.1 99.0 388.1 1 22 2 2 R-Sq (pred) 98.9 72.3 98.9 98.7 Mallows Cp 7.1 542.9 5.7 9.0 X S 1 3.9403 19.389 X 3.7418 X 4.0433 XmX X X 2 3 X X X X


Q: One-Sample Statistics N Mean 8 Std. Deviation Std. Error Mean 10.74377 3.79850 One-Sample Test…
A:
Q: 4. After seven netball matches, Kai has averaged 11 goals per game. a. Find the value of a. 7 a 9 13…
A:
Q: . Which of the variables is quantitative? a. the name of the division holding the meeting b.…
A: Quantitative variable: The variable which can take numerical values is called quantitative variable.
Q: Boys and girls: The National Health Statistics Reports reported that a sample of 310 one-year-old…
A: Given X1-bar=25.3 X2-bar=24.3 n1=310 n2=286
Q: 4. We have the temperatures in several cities of Spain: Aviles (11°C), Barcelona (17°C), Madrid…
A: The temperatures in several cities of Spain is as Cities Temperatures in 0C Aviles 11…
Q: Let the joint PDF of two RV x, y be: -A, for-2≤a≤2, 0≤b≤1, fx,y (a, b) = {0, otherwise. Derive the…
A: Solution
Q: Of all awarded prizes, 2% are worth $1000, 10% are worth $100, and 88% are worth $10. Let X be the…
A:
Q: If X and Y are two random variables, then the covariance of x+a,Y +b,where a and b are constant is…
A:
Q: Assume that the IQ scores have a normal distribution with mean 100 and standard deviation of 8…
A:
Q: To determine which of the two models above – BIG or small – is statistically superior at the .05…
A:
Q: Group of answer choices H0 : population average = 4.7% H1 : population average > 4.7% H0 :…
A:
Q: We believe that 81% of the population of all Business Statistics students consider statistics to be…
A:
Q: FIND A 90% CONFIDENCE INTERVAL FOR THE DIFFERENCE IN POPULUTION PROPORTIONS Pf -Pm round your…
A: Given: n1=100, n2=50, p1^=0.24, p2^=0.43 We find the 90% C.I. for the difference in population…
Q: the 95% confidence interval for estimating the population mean μ If sample mean X = 50, sample size…
A: We have given that Sample size = 60 Sample mean = 50 Population standard deviation = 10. 95%…
Q: A sports trainer wants to know whether the true average time of his athletes who are 100-meter…
A:
Q: 7. Suppose a game is to be played with a single die, assumed fair, where the player wins the dollar…
A: The expectation of a discrete random variable X, denoted by E(X), is defined as a measure of central…
Q: Suppose we examined medical records of 500 individuals admitted to the hospital, and we…
A: According to aur policy we can answer only first three part for remaining please repost the…
Q: on the two common operating systems in the smartphone market. She wants to decide in which system to…
A:
Q: A researcher obtained students' average SAT scores in each of the 50 states and the average teacher…
A: As per Bartleby guidelines I can't answer more than one question per post. Please post other…
Q: If you use a 0.10 level of significance in a two-tail hypothesis test, what is your decision rule,…
A: Given :If you use a 0.10 level of significance in a two-tail hypothesis test, what is your decision…
Q: In a large population of college-educated adults, the mean IQ is 112 with standard deviation 50.62.…
A: We have given that Mean(µ) = 112Standard deviations (σ) = 50.62n = 30
Q: Describe how the inverse transform method is used to generate a sequence of 5 service times (unit:…
A: We are required to generate 5 simulated numbers using the given decimal numbers lying between 0 and…
Q: Enumerate and explain each briefly the FOUR (4) Important Properties of a Test of Hypothesis.
A: Given that We have to define the importance properties of testing of Hypothesis:
Q: A sample has a mean of M = 50. If one new person is added to this sample, what effect will this have…
A: The sample mean is defined as M = Σx/n, where the value of observation is x and n is the total…
Q: Compute the CDF F(a), the expected value E(x), the second statistical moment E[x²], and the variance…
A:
Q: Follow the steps in Test of Hypothesis (pic) including your conclusion and round off the critical…
A:
Q: Determine the given, create a hypothesis, compute the test statistic, identify and draw the critical…
A: Consider that μ is the population mean filtration efficiency rate of all N95 face masks.
Q: 16-20. The Philippine constitution calls for 16 representatives to be chosen from these cities. The…
A: Solution: From the given information, number of representatives to be chosen is 16. The given data…
Q: 1:10 ЬА 19 For numbers 1 to 3: The thermal condition in a cave is critical for sustaining a bat…
A:
Q: Data point X value is 120 and has an assigned weight of 5 Data point Y value is 300 and has an…
A:
Q: The following nine observations were drawn from a normal population: 9 20 24 23 29 21 17 27 (i) Test…
A:
Q: 3. An experiment was performed to compare the abrasive wear of two different laminated materials.…
A: The question is based on a hypo. testing Given : Total no. of pieces of material 1 ( n1 ) = 12…
Q: Sales for the past 6 months at Dalworth Company are given in the following table: Month Sales July…
A: Mean absolute deviation for forecast: here, we have to find out the mean absolute…
Q: 7.24).
A: * SOLUTION :- From the given information the answer is provided as below
Q: It is desired to know the true proportion of divers who get "the bends" (sickness from nitrogen in…
A: Sample size is crucial to inferential statistics.
Q: 1.The test scores of Biostatistics examination follows a normal distribution with a mean of 60 and a…
A:
Q: SAT math scores are normally distributed with the parameters below. μ=500σ=100 What is the…
A: Given distribution is normally distributed with mean=500 and standard deviation=100 Let, X: SAT math…
Q: 1. (a) Let X be a continuous, non-negative (that is, P(X ≥ 0) = 1) random variable with PDF f. Show…
A:
Q: tabase that are investor-owned for-profit. (Hint: In Control, 5 = investor-owned for-profit.) From…
A: Gov Fed Gov NonFed InvestorOwned For Profit NonGov Non Profit Other Nonprofit Grand Total 1…
Q: From the Pearson r coefficient -0.63 compute for the coefficient of determination then interpret.
A: Pearson correlation coefficient: The pearson's r coefficient is a type of corr. coefficient that…
Q: The scores on the Wechsler Adult Intelligence Scale are approximately Normal, with = 100 and = 11.…
A: The scores on the Wechsler Adult Intelligence Scale are approximately Normal
Q: For two random variables X and Y, var(X + Y) = var(X)+ var(Y)+2 Cvy and var(X – Y) = var(X)+…
A:
Q: 7.18 Show that the fitted regression plan passes through the point (x1,x2,..
A: *Answer:
Q: A sample of scores has a mean of M = 20, a median of 28, and a mode of 29. What is the most likely…
A: Given Mean=20 Median=28 Mode=29
Q: side effects and 82% did not have side effects. A study was run on 325 children to see if the…
A:
Q: Suppose we are studying the risk factors associated with mortality of Covid-19 patients admitted to…
A: Solution: Here, it is needed to decide logistic regression or the Cox PH regression should be…
Q: 7 How do i derive the quadratic and cubic functions from the point group
A: Given information: Quadratic function from the point group. Note: - As per guidelines we will solve…
Q: 14. What is the answer in (9) in the ANOVA Table? (4 decimal)
A: The ANOVA table is Source DF Adj SS Adj MS F-value P-value Regression k=3 Adj MS*3…
Q: The following data represent the length of life in minutes, measured to the nearest tenth, of a…
A: Given data indicates a random sample of 50 black mosquitoes subjected to a new spray in a laboratory…
Q: A student was asked to find a 99% confidence interval for the proportion of students who take notes…
A: Solution-: Given n=89. and 99% C.I. for population proportion p is, 0.12<p<0.34
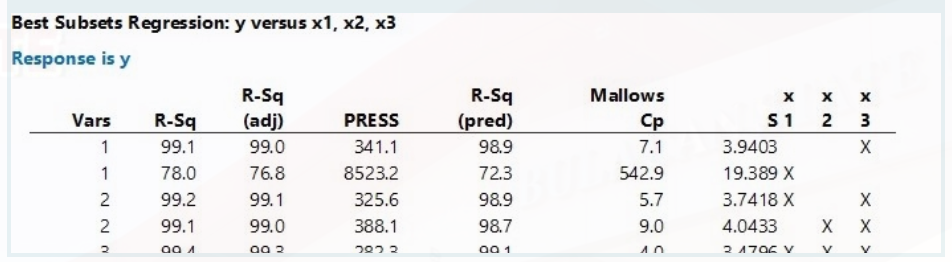
24. Using the adjusted R2, which variables is/are included in the best set of the model?

Step by step
Solved in 2 steps

- Special Rounding Instructions For this exercise set, round all regression parameters to three decimal places, but round all other answers to two decimal places unless otherwise indicated. Gray Wolves in WisconsinGray wolves were among the first mammals protected under the Endangered Species Act in the 1970s. Wolves recolonized in Wisconsin beginning in 1980.Their population grew reliably after 1985 as follows: Year Wolves Year Wolves 1985 15 1993 40 1986 16 1994 57 1987 18 1995 83 1988 28 1996 99 1989 31 1997 145 1990 34 1998 178 1991 40 1999 197 1992 45 2000 266 a. Explain why an exponential model may be appropriate. b. Are these data exactly exponential? Explain. c. Find an exponential model for these data. d. Plot the data and the exponential model. e. Comment on your graph in part d. Which data points are below or above the number predicted by the exponential model?XYZ Corporation Stock Prices The following table shows the average stock price, in dollars, of XYZ Corporation in the given month. Month Stock price January 2011 43.71 February 2011 44.22 March 2011 44.44 April 2011 45.17 May 2011 45.97 a. Find the equation of the regression line. Round the regression coefficients to three decimal places. b. Plot the data points and the regression line. c. Explain in practical terms the meaning of the slope of the regression line. d. Based on the trend of the regression line, what do you predict the stock price to be in January 2012? January 2013?Special Rounding Instructions For this exercise set, round all regression parameters to three decimal places, but round all other answers to two decimal places unless otherwise indicated. Postal RatesThe table below shows the cost s, in cents, of a domestic first-class postage stamp in the United States tyears after 1900. t=time,inyearssince1900 s=costofstamp 19 2 32 3 58 4 71 8 78 15 85 22 95 32 102 37 109 44 116 47 a.Use exponential regression to model s as an exponential function of t. b.What cost does your model give for a 1988 stamp? Report your answer to the nearest cent. The actual cost was 25cents. c.Plot the data and the exponential model.
- Special Rounding Instructions. For this exercise set, round all regression parameters to three decimal places, but round all other answers to two decimal places unless otherwise indicated. Caloric Content Versus Shell Length In 1965, Robert T.Paine gathered data on the length L, in millimeters, of the shell and the caloric content C, in calories, for a certain mollusk. The table below is adapted from those data. L=length C=Calories 7.5 92 13 210 20 625 24 1035 31 1480 a.Find an exponential model of calories as a function of length. b.Plot the graph of the data and the exponential model. Which of the data points show a good deal less caloric content than the model would predict for the given length? c.If length is increased by 1millimeter, how is caloric content affected?Use Excel to find an estimated linear regression equation using X1 and X2 as the independent variables and Y as the dependent. Put your output on a fresh sheet. Then answer the following questions (excel chart in the picture) Write down the estimates regression equation What is the expected value of Y if X1 is 240 and X2 is 290? Show your calculation at a 5%level of significance, are the true coefficients of X1 and X2 different from zero? Justify briefly using numbers from your excel output. 4. Using Excel, determine a 97% confidence interval for the true coefficient of X1a) Give the estimated regression function. Also, give the hypothesis, test statistic and the rejection region to assess whether the interactive terms contribute to reducing the mean variation of the response variable. Test at ? = 0.05. Then How can the conclusion be confirmed? Explain the result.
- 27. Using the stepwise regression, what is the value of adjusted R2 of the last step?Using the regression line attached. The plot: a) reveals sure evidence that the population slope is unequal to 0 b) reveals sure evidence that the sample slope is unequal to 0 c) can be used alone to reject the null hypothesis that the population slope is unequal to 0 d) can be used alone to reject the null hypothesis that the population slope is equal to 0 e) a and c f) a and dWhich statistic is associated only with multiple regression and not with simple regression? adjusted R2 partial F test estimated or predicted value z-test
- Disk drives last time Here is a scatterplot of the residu-als from the regression of the hard drive prices on their sizes from Exercise 18.a) Are any assumptions or conditions violated? If so,which ones?b) What would you recommend about this regression?magine that you first estimate an OLS regression with a random sample of 100 observations and then re-estimate the same regression with 100 additional observations which are also randomly sampled. What would you expect to happen as the sample size increases? a. R-squared increases b. t-statistic decreases c. Sum of squared residuals decreases d. the standard error gets smallerThis assignment involves putting together a scenario where you are asking a question that requires analyzing data - doing a hypothesis test or determining what variables are statistically significant using your favorite statistical analytical tool learned in this course. The tools you have learned include z and t-test one population, two population, and ANOVA (regression analysis and prediction using linear regression or multivariable regression). Pretend you are the CEO and the analyst doing the analysis. Write the scenario using APA style formatted paper: Title page, Introduction, Body (with category sectional headings), Conclusion, and Reference.