. Summarize data in a frequency distribution table using a 5-gram interval. B. Illustrate data in a frequency histogram using a 5-gram interval. C. Compute for relative frequency of 3rd interval and cumulative relative frequency of the 4th interval.
Q: Find the mean of the data summarized in the given frequency distribution. Compare the computed mean…
A: mean = x̅ =Σf*M/Σf
Q: 4. A survey is given to 1,432 people about whether they take daily supplemental vitamins and whether…
A: Total number of people = 1432Percentage of number of people who eat breakfast and take daily…
Q: Construct a frequency table with the following information: lower class boundary, u class boundary,…
A: Hello! As you have posted more than 3 sub parts, we are answering the first 3 sub-parts(lower class…
Q: 1. Suppose you asked a sample of 12 correctional officers for the number of serious injuries they…
A:
Q: Find the mode of the frequency distribution shown in Activity 2
A: Given : Class interval f 15 - 24 5 25 - 34 10 35 - 44 11 45 - 54 23 55 - 64 26 65 -…
Q: The following is the frequency distribution of a sample of students from Taibah University, in…
A: Since you have posted a question with multiple subparts, we will solve first three subparts for you.…
Q: a. How many employees collect less than 3,000 miles? b. Convert the frequency distribution to a…
A: The given frequency distribution is:
Q: The following table shows the frequency of outcomes when two distinguishable coins were tossed 5,000…
A: Solution: From the given information, The relative frequency is calculated by using the following…
Q: Construct a frequency distribution table of 4 classes for the collecting data and find the relative…
A: Frequency for an interval is equal to the number of observations that lie in that interval. For…
Q: A random sample of 30 male college students was selected, and their heights were measured. The…
A: Given data, 66 66 74 67 73 6671 69 66 74 68 7370 73 74 68 67 7273 71 69 72 67 6872 73 73 69 73 67…
Q: 1- Following is the number of emergency calls made in 35 consecutive days by an ambulance server…
A: The representation of frequency distribution has two ways. one is tabular form, another method is…
Q: A biologist measured the lengths of hundreds of cuckoo bird eggs. Use the relative frequency…
A: Given relative frequency distribution is: Length (in mm) Percent of eggs 18.75-19.75 0.8…
Q: Consider the following frequency table representing the distribution of the length of a morning walk…
A: Solution-: We have following table: Length of a Walk (in miles) Class Frequency 0.26-0.32 6…
Q: The Quick Change Oil Company has a number of outlets in the metropolitan Seattle area. The daily…
A: Hi there! Thank you for posting the question. As your question has more than 3 parts, we have solved…
Q: A biologist measured the lengths of hundreds of cuckoo bird eggs. Use the relative frequency…
A: (a) Obtain the percent of group of eggs was less than 24.75 long. The percent of group of eggs was…
Q: The frequency distribution for the commission earned (in dollars) by salespeople employed at several…
A:
Q: Refer to the table below that shows the frequency distribution of the neigi students. Height (in…
A: Frequency distribution table : A distribution table could be a graph that shows the frequency of…
Q: A biologist measured the lengths of hundreds of cuckoo bird eggs. Use the relative frequency…
A:
Q: Construct the corresponding relative frequency distribution for the given frequency distributio
A: The relative frequency can be calculated as Relative frequency = frequency/Total frequency
Q: Consider the following frequency table representing the distribution of the length of a morning walk…
A: Formula to find midpoint of class is , Midpoint = Lower limit of class + upper limit of class 2
Q: Taliba took a survey of 155 recent high school graduates. Using the frequency table of her results…
A: Dear student as per guidelines we solve only first question when multiple unrelated questions are…
Q: 12. FILE The Quick Change Oil Company has a number of outlets in the metropolitan Seat- tle area.…
A: Since you have posted a question with multiple sub parts, according to our guidelines we can solve…
Q: biologist measured the lengths of hundreds of cuckoo bird eggs. Use the relative frequency…
A: Given that: A frequency in percentage table is given here by using this information we find tha…
Q: The following data show the method of payment by 16 customers in a supermarket checkout line. Here,…
A: a. The frequency of each class is obtained by counting the number of times each data point appeared…
Q: Length of a Walk (in Miles) Class 0.34-0.40 0.41-0.47 Frequency 7 13
A: Formula used for midpoint . (upper class + lower class)/2
Q: What type of frequency graph is appropriate when counting the number of: (a) Blondes, brunettes,…
A: a) Blondes, brunettes, redheads and others participating in the school can be shown using bar…
Q: The following table summarizes the ages of 189 people qualifying for disability insurance. Use the…
A: age class frequency f xi fx 24-29 22 26.5 583 30-35 13 32.5 422.5 36-41 26 38.5 1001 42-47…
Q: A biologist measured the lengths of hundreds of cuckoo bird eggs. Use the relative frequency…
A:
Q: Complete the given relative frequency distribution and compute the stated relative frequencies.
A:
Q: The College Registrar’s Office recorded the number of students receiving incompletes over the past…
A: a)
Q: FILE The following is the number of minutes to commute from home to work for a group of 25…
A: Since you have posted a question with multiple sub parts, according to our guidelines we can solve…
Q: Complete the frequency distribution table: descending cumulative frequency Class Class centre |…
A: The total frequency is equal to 50 The percentage of frequencies are given. Calculate the missing…
Q: 2. The salaries (in millions of dollars) for 31 NFL teams for a specific season are given in this…
A: 2. The frequency distribution for the salaries in class along with frequencies.
Q: A biologist measured the lengths of hundreds of cuckoo bird eggs. Use the relative frequency…
A: From the given table total percentage of X is 100
Q: A biologist measured the lengths of hundreds of cuckoo bird eggs. Use the relative frequency…
A: (a) Consider the given table. From the table percent of the group of eggs was less than 22.75 mm…
Q: Refer to the accompanying data set and use the 25 home voltage measurements to construct a frequency…
A: Frequency Distribution The number of occasions a measure did appear in a data source is its…
Q: 2. A group of adults where asked how many cars they had in their household a. Complete the frequency…
A: Consider the given equation: Here, the given data of cars they had in their household,
Q: If the prices of 500 pieces of jewelry (in peso and in centavo) are such lowest is 435.00 and the…
A: In this case, the minimum value is 435 and the maximum value is 95,795. Hence, the range is n =…
Q: hundreds of cuckoo bird eggs. Use the relative frequency distribution in the table below to answer…
A:
Q: The following table shows the frequency of outcomes when two distinguishable coins were tossed 4,000…
A: The relative frequency can be calculated as R.f = frequency/Total
Q: A biologist measured the lengths of hundreds of cuckoo bird eggs. Use the relative frequency…
A: Hello! As you have posted 3 different questions, we are answering the first question. In case you…
Q: 2. The number of class intervals in a frequency distribution (or bar chart) will be approximately…
A: Range = Maximum -Minimum
Q: If a set of scores for a variable is displayed in a frequency distribution polygon, which scale of…
A: The four different scales : Nominal, Ordinal, Interval and Ratio represent levels of measurements of…
Q: Refer to the table below that shows the frequency distribution of the heights of 45 SHS students.…
A:
Q: Refer to the (incomplete) grouped frequency table data below which depicts the calorie content (in…
A: Since you have posted question with multiple subparts,we will solve first three subparts for you.To…
Q: Find the mean of the frequency given in frequency table bel Class Frequency 17 12 1 9. 4 13 8. 25 9.…
A:
Q: In a survey of 35 families in a village, the number of children per family was recorded and the…
A: Given Data 1,0,2,3,4,5,6,7,2,3,4,0,2,5,8,4,5,12,6,3,2,7,6,5,3,3,7,8,9,7,9,4,5,4,3 We want to make…
Q: Data was collected for 225 fish from the North Atlantic. The length of the fish (in cm) is…
A: The histogram of length of 225 fishes are given.
Q: Find the mean of the data summarized in the given frequency distribution table below. Score…
A:
Q: Construct the frequency distribution table with the detailed parts.
A: 1 15 2 26 3 34 4 36 5 38 6 41 7 43 8 44 9 45 10 50 11 50 12 51 13 52 14 52…
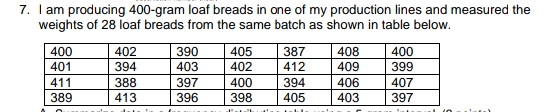
7. I am producing 400-gram loaf breads in one of my production lines and measured the
weights of 28 loaf breads from the same batch as shown in table below. (*see attached image for the table.)
A. Summarize data in a frequency distribution table using a 5-gram interval.
B. Illustrate data in a frequency histogram using a 5-gram interval.
C. Compute for relative frequency of 3rd interval and cumulative relative frequency of the 4th interval.
Step by step
Solved in 3 steps with 2 images
- Between 1971 and 1975, as part of the National Health and Nutrition Examination Survey (NHANES), 7,381 persons ages 40–77 years were enrolled in a follow-up study. At the time of enrollment, each study participant was classified as having or not having diabetes. During 1982–1984, enrollees were documented either to have died or were still alive. The results are summarized as follows. 1. Of the men enrolled in the NHANES follow-up study, calculate the ratio of non-diabetic to diabetic men. 2. Calculate the proportion of men in the NHANES follow-up study who were diabetics. 3. Calculate the proportion of deaths among men.A company studied the number of lost-time accidents occurring at its Brownsville, Texas, plant. Historical records show that 6% of the employees suffered lost-time accidents last year. Management believes that a special safety program will reduce such accidents to 5% during the current year. In addition, it estimates that 15% of employees who had lost-timeaccidents last year will experience a lost-time accident during the current year. a. What percentage of the employees will experience lost-time accidents in both years?b. What percentage of the employees will suffer at least one lost-time accident over the two-year period?Consider a case where 400 fish are tagged and released during a first outing. During a second outing in the same area, 400 fish are again caught and released, of which half are already tagged. Estimate N, the total number of fish in the entire sampling area.
- Suppose that in 2008, 628,250 citizens died of a certain disease. Assuming the population of the country is 211 million, what was the morality rate in units of deaths per 100,000 people ?29-What percentage of students are enrolled in between 12 and 18 credits?a) What proportion of 20% of defective items should a supervisor in the quality system of a plastic products company accept when they ask him to evaluate a routine inspection procedure for orders of 100 identical articles, knowing that the procedure consists of taking a sample of 10 items and the one to accept the order if no more than 2 defective items are found? b) How many defective items are expected to appear in the sample?
- Is the number of games won by a major league baseball team in a season related to the team batting average? The table below shows the number of games won and the batting average (in thousandths) of 8 teams. Team Games Won Batting Average 1 8383 289289 2 116116 290290 3 101101 287287 4 8181 262262 5 110110 288288 6 119119 269269 7 6060 268268 8 6161 280280 Using games won as the explanatory variable xx, do the following: (a) The correlation coefficient is r=r= . (b) The equation of the least squares line is y^=y^=The table below is a measure of how many ounces of caffeinated coffee a person drinks and how much sleep they get. Ounces of coffee Hours of sleep.22 8.924 6.338 5.922 6.819 7.435 6.428 7.219 7.627 8.928 9.325 5.418 6.135 4.333 8.128 5.817 6.325 4.832 5.418 7.522 6.825 4.735 6.541 4.218 7.351 6.818 5.932 8.127 4.138 5.841 6.452 7.718 9.434 4.541 3.533 6.837 9.228 6.151 9.217 6.318 4.525 6A) Give the Pearson coefficient. B) Now that you found the answer to A, do you expect there to be a strong correlation?Is the number of games won by a major league baseball team in a season related to the team batting average? The table below shows the number of games won and the batting average (in thousandths) of 8 teams. Team Games Won Batting Average 1 9797 269269 2 9595 275275 3 8686 273273 4 9999 261261 5 6464 285285 6 118118 260260 7 8787 274274 8 8888 280280 Using games won as the explanatory variable ?x, compute the correlation coefficient
- A new machine is set or calibrated to fill tubes of toothpaste at precisely 6.75 ounces. Then, once the machine is running, a sample of six tubes is taken every three hours and weighed with the following results: WEIGHT OF TOOTHPASTE Time 7 am 6.69 6.68 6.79 6.77 6.74 6.76 10 am 6.71 6.72 6.71 6.76 6.75 6.74 1 pm 6.66 6.68 6.67 6.71 6.76 6.78 4 pm 6.73 6.74 6.72 6.76 6.78 6.75 7 pm 6.75 6.73 6.75 6.77 6.79 6.75 The measurement of quality is based on _______. A. a scale B. an attribute C. a chart D. a variableThe following data has been collected on the interarrival times of patients to an emergency department: 3.772, 1.761, 0.743, 15.988, 0.412, 7.541, 6.900, 3.447, 7.024, 1.061, 5.449, 0.309, 0.766, 4.807, 8.143, 0.093, 9.524, 0.012, 4.634, and 0.195 minutes. Estimate the squared coefficient of variation of the arrival process. Is the arrival process likely to be Poisson? Why or why not? Estimate the arrival rate?A Farm grows normally distributed potatoes and is testing a new crop. After 4 months, 20 plants produce potatoes with the following weights (in kg):7, 1.4, 1.4, 1.3, 0.3, 1.4, 0.6, 1.3, 1.3, 1.1, 0.9, 1.5, 1.1, 1.5, 0.6, 1.4, 1.1, 0.5, 0.6, 0.8 b) What percent of potatoes grown from this crop will be over 2 kg? Mean: 1.1 Standard deviation: 0.3883