Construct a frequency distribution table of 4 classes for the collecting data and find the relative frequency.
Construct a frequency distribution table of 4 classes for the collecting data and find the relative frequency.

Glencoe Algebra 1, Student Edition, 9780079039897, 0079039898, 2018
18th Edition
ISBN:9780079039897
Author:Carter
Publisher:Carter
Chapter10: Statistics
Section10.6: Summarizing Categorical Data
Problem 4DGP

Related questions
Question
100%
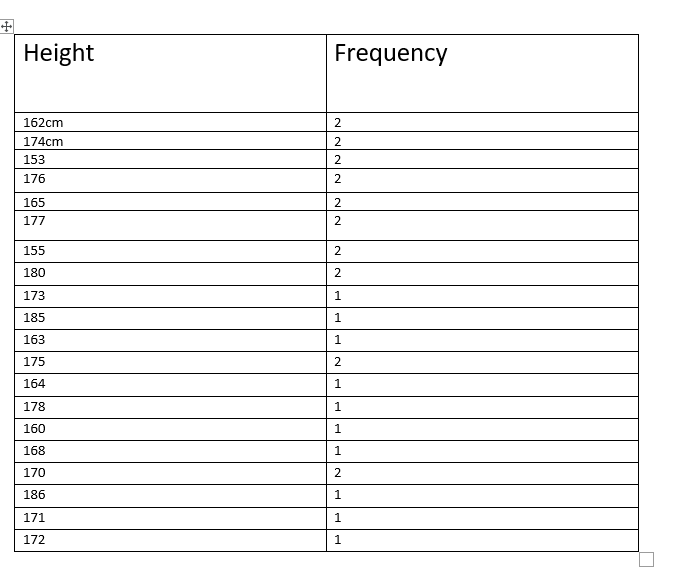
Transcribed Image Text:Height
Frequency
162cm
174cm
2.
153
176
2.
165
2
177
2
155
180
2.
173
1.
185
1.
163
1.
175
164
1.
178
1
160
1
168
1
170
186
1
171
1
172
1.

Transcribed Image Text:Construct a frequency distribution table of 4 classes for the collecting data and find the relative
frequency.
Expert Solution
This question has been solved!
Explore an expertly crafted, step-by-step solution for a thorough understanding of key concepts.

Step by step
Solved in 4 steps with 9 images

Knowledge Booster


Learn more about
Need a deep-dive on the concept behind this application? Look no further. Learn more about this topic, statistics and related others by exploring similar questions and additional content below.Recommended textbooks for you
Glencoe Algebra 1, Student Edition, 9780079039897…
Algebra
ISBN:
9780079039897
Author:
Carter
Publisher:
McGraw Hill
Glencoe Algebra 1, Student Edition, 9780079039897…
Algebra
ISBN:
9780079039897
Author:
Carter
Publisher:
McGraw Hill