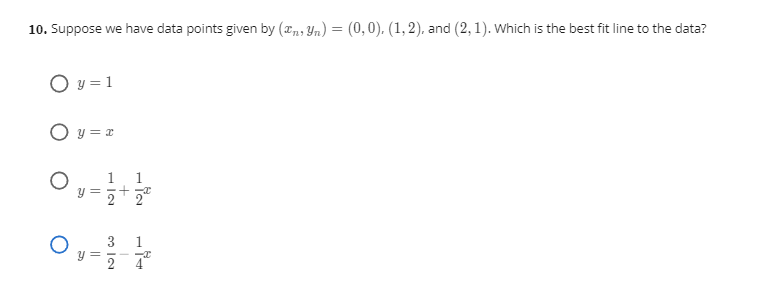
. Suppose we have data points given by (z,, yn) = (0,0), (1, 2), and (2, 1). Which is the best fit line to the data? O y = 1 O y = = 0, 1 y = 1 3 1


Q: Based on the data shown below, calculate the regression line (each value to two decimal places) y =…
A: The data is x y 3 16.4 4 14.66 5 13.32 6 10.98 7 6.04 8 7
Q: Consider the following data points: r|-1 0 0 2 2 y-1 0 1 1 2 Find the best-fit line y = a+ Bx for…
A: note : As per our company guidelines we are supposed to answer ?️only the first question. Kindly…
Q: Obtain the equations of the lines of regression of Y on X from the following data. X : 12 18 24 30…
A: Introduction: Consider that x is the independent variable and y is the dependent variable. The size…
Q: For which of the following models is y-hat = exp(b0 + b1x +se2/2) used to find the predicted value…
A: Solution
Q: Based on the data shown below, a statistician calculates a linear model - 0.76x + 17.64. | y 3 14.3…
A: Predict the value of y when x equals 3. The predicted value of y when x equals 3 is obtained below…
Q: ou are given t
A: Given, the data for output at a company and costs of production over the past 4 years Year…
Q: Which boxplot below represents the data? OA. В. Q 0.5 1.5 C 0.5 15 C Absorption Rates (Wikg)…
A: Procedure for constructing boxplot: The x-axis represents the units of data values ranging from 0.5…
Q: Use Equations (3.5) and (3.6) to estimate the coefficients of the line y = ax + b such that the sum…
A: Note: Hi, thank you for the question. As per our company guideline we are supposed to answer only…
Q: Based on the data shown below, calculate the regression line (each value to two decimal places) y =…
A: Calculate the mean of X and Y.
Q: Let the following data be given - let x be independent variable and y be a depending variable and…
A: Simple linear regression is a regression model that estimates the relationship between one…
Q: 5p Find the best fit model. 3,1,3,9,27 y:(-1,0,1,2,3} Sn
A: Given that x:13, 1, 3, 9, 27 and y:-1, 0, 1, 2, 3. Note that at x=1, y=0. Therefore, the…
Q: Given are five observations for two variables, x and y. x;| 3 12 6 20 14 yi | 55 40 55 10 15 a.…
A:
Q: Q2) Given the data points (0,7), (2,11), (3,28) use Lagrange's method to determine У(1).
A:
Q: Given are five observations for two variables, and . xi 1 3 12 15 17 yi 54 51 43 25 12 The…
A: Note: Please repost 2nd question as i can answer only 3 subparts as per my policy. X Y X*Y X*X…
Q: Suppose (; – a)² = 4, E(yi = 9)² = 10, and (r-7)(yi – 9) = 20. Then the slope coefficient from an…
A:
Q: 5. Fit the following data in a linearly regressed line. Find the co-efficient of variation. x, cm 2…
A:
Q: Given are five observations for two variables, x and y. xi 1 2 3 4 5 yi 4 7 4 11 14 Develop…
A: Given are five observations for two variables, x and y. xi 1 2 3 4 5 yi 4 7 4 11 14
Q: Question 7: Based on the data shown below, calculate the regression line (each value to at least two…
A: Given: Sample size(n)=8∑x=44∑y=107.2∑x2=284∑y2=1501.86∑xy=640.1
Q: Given are five observations collected in a regression study on two variables. x₁ 2 6 9 13 20 V₁9 19…
A: Solution-: Given data: X Y 2 9 6 19 9 7 13 26 20 21 We want to (a) Draw the scatter…
Q: Based on the data shown below, calculate the regression line (each value to two decimal places) y =…
A: Given data x y 3 16.4 4 14.66 5 13.32 6 10.98 7 6.04 8…
Q: Given are five observations for two variables, x and y. x 5 11 8 23 18 y 50 47 50 10 23 Develop the…
A: The value of slope and intercept of the regression line are computed as follows:
Q: 1. Which one of the following is the OLS estimator of the slope term for the regression model Y = Bo…
A: 1. The OLS estimator of the slope term for the regression model, Yt=β0+β1Xt+ut is, β^1=∑t=1T…
Q: With the help of data given in the following table calculate regression line Y'. ΣΧ ΣΥ ΣΧΥ Σχ2 15 25…
A:
Q: A-) Find the correlation coefficient between the streams at the two stations. B-) Determine whether…
A: B (X) A (Y) (x-xbar) (x-xbar)^2 (y-ybar) (y-ybar)^2 (x-xbar)*(y-ybar) 130.19 40.41 -62.1786…
Q: Consider the bivariate data set with n = 7 observations X 1 7 -5 2 7 5 4 Y 35 77 13 22 69 69 59…
A: The independent variable is X. The dependent variable is Y. This is simple linear regression model.…
Q: 4. (a) The equations of two regression lines obtained in a correlation analysis are 3X+12Y 19 and 3Y…
A: We rearrange the regression equations as follow 3x+12y=19⇒12y=-3x-19⇒y=-x4-1912 Thus regression…
Q: 8) The relationship between the TSLS slope and the corresponding population parameter is: (Z; - Zju;…
A: Since you have asked multiple question, we will solve the first question for you. If youwant any…
Q: Given are five observations for two variables, x and y. xi 1 2 3 4 5 yi 4 6 5 9 14 Develop…
A: Given data, X Y X*Y X*X 1 4 4 1 2 6 12 4 3 5 15 9 4 9 36 16 5 14 70 25
Q: Let the following data be given - let x be independent variable and y be a depending variable and…
A: Provided data is; x y 2 15 3 19 5 21 7 22 8 23 We want to test the hypothesis is…
Q: The two data sets are dependent. Findd to the nearest tenth. X| 11.2 11.3 11.6 12.9 10.6 5) Y 11.1…
A: Given Data X Y D = X-Y 11.2 11.1 0.1 11.3 12.6 -1.3 11.6 12.9 -1.3…
Q: Given are five observations for two variables, x and y. xi 1 2 3 4 5 yi 4 6 6 11 13 Develop the…
A: Given: n=5 The formulas of b0 and…
Q: In each of the following cases, find the best predicted value for y given that x = 3.00. The given…
A: We have given that the regression line y^ = 6.00 + 3.00x Here, need to find out the best predicted…
Q: Given are five observations for two variables, * and y. Excel File: data14-25.xlsx The estimated…
A: Given information:
Q: Given the following data n= 5, Σ x = 15, Σ ( -X)10. Σ (-7- 26, Σ ( ΧYY-= 13 Compute the…
A: Given n=5, ∑x=15, ∑y=20, ∑X-X¯2=10, ∑Y-Y¯2=26, ∑X-X¯Y-Y¯=13
Q: For the following pairs of points, verify that the least square regression line is Y'= 1.8X -8.5.…
A: Regression: In order to obtain the least square regression line, first perform regression analysis…
Q: Based on the data shown below, calculate the regression line (each value to two decimal places) y =…
A:
Q: Given are five observations for two variables, x and y. xi 3 12 6 20 14 yi 55 45 50 15 20 #1)…
A:
Q: Given the following sample statistics X(bar) = 20, Y(bar) = 200, Sx = 100, Sy = 60, Rxy = 0.4, n =…
A:
Q: Assume that the differences are normally distributed. Complete parts (a) through (d) below.…
A: The following table gives the differences.
Q: 1. The values of (x, y) are given by the table 13 H8 x0|1 2 | 3 4 y | 2 | 3 5 | 4 | 6 Find the least…
A:
Q: Consider the following pairs of points for the variables X nd Y. What is the value for SSE or the…
A: We have given that, SSxx = 54.5 SSyy = 54.5 SSxy = -50.5 Se = 0.98148
Q: Using the same set of data as questions 4 and 5, what would be the "a" coefficient be if we force…
A: Regression expresses the relationship between variables in the form of equation. Y=a+bX where,…
Q: Consider the data. x, 12 3 45 y, 4 8 5 11 12 The estimated regression equation for these data is ŷ =…
A: The given data is x y 1 4 2 8 3 5 4 11 5 12
Q: Given are five observations for two variables, and y. Excel File: data14-25.xlsx xi Yi 0.9726 2 7…
A: The standard error is the error occur in the observation. The standard error of estimate is…
Q: Find the multiple regression line Y on X, and X2 from the following data, 12 10 2 2 1 Y 9. 13 20 3 4…
A: Multiple linear regression is a regression model that estimates the relationship between a dependent…
Q: The following information is obtained from a sample data set. = 12, x = 42, y = 564, xy = 570, = 186…
A:
Q: Given are five observations for two variables, x and y. xi 1 2 3 4 5 yi 4 5 5 10 14 Which of the…
A: Use EXCEL to construct the scatter plot. EXCEL procedure: Go to EXCEL Go to Insert menu…

Step by step
Solved in 2 steps with 2 images

- Find the equation of the regression line for the following data set. x 1 2 3 y 0 3 4The table below shows the number of state-registered automatic weapons and the murder rate for several Northwestern states. xx 11.3 8.6 7.1 3.3 2.4 2.3 2.4 0.7 yy 13.7 11.1 10.4 6.9 6.4 6.2 6.1 4.9 xx = thousands of automatic weaponsyy = murders per 100,000 residentsThis data can be modeled by the equation y=0.83x+4.28.y=0.83x+4.28. Use this equation to answer the following;Special Note: I suggest you verify this equation by performing linear regression on your calculator.A) How many murders per 100,000 residents can be expected in a state with 10.7 thousand automatic weapons?Answer = Round to 3 decimal places.B) How many murders per 100,000 residents can be expected in a state with 1.6 thousand automatic weapons?Answer = Round to 3 decimal places.The table below shows the number of state-registered automatic weapons and the murder rate for several Northwestern states. xx 11.3 8.6 7.1 3.3 2.4 2.3 2.4 0.7 yy 13.7 11.1 10.4 6.9 6.4 6.2 6.1 4.9 xx = thousands of…The table below shows the number of state-registered automatic weapons and the murder rate for several Northwestern states. xx 11.8 8.6 7.1 3.9 2.5 2.6 2.4 0.4 yy 14.3 11.5 9.8 7.6 6.2 6.5 6.4 4.1 xx = thousands of automatic weaponsyy = murders per 100,000 residentsThis data can be modeled by the equation y=0.86x+4.07.y=0.86x+4.07. Use this equation to answer the following; Special Note: I suggest you verify this equation by performing linear regression on your calculator.A) How many murders per 100,000 residents can be expected in a state with 3 thousand automatic weapons?Answer = Round to 3 decimal places.B) How many murders per 100,000 residents can be expected in a state with 4.1 thousand automatic weapons?Answer = Round to 3 decimal places.
- The table below shows the number of state-registered automatic weapons and the murder rate for several Northwestern states. xx 11.9 8.5 6.8 3.8 2.5 2.3 2.7 0.3 yy 14.1 11.2 9.6 7.1 6.4 6.3 6.4 4.2 xx = thousands of automatic weaponsyy = murders per 100,000 residentsThis data can be modeled by the equation y=0.83x+4.13.y=0.83x+4.13. Use this equation to answer the following;Special Note: I suggest you verify this equation by performing linear regression on your calculator.A) How many murders per 100,000 residents can be expected in a state with 2.6 thousand automatic weapons?Answer = Round to 3 decimal places.B) How many murders per 100,000 residents can be expected in a state with 2.4 thousand automatic weapons?Answer = Round to 3 decimal places.The table below shows the number of state-registered automatic weapons and the murder rate for several Northwestern states. xx 11.7 8.4 7 3.8 2.7 2.3 2.5 0.3 yy 14.2 11.4 10.2 7.4 6.3 6.1 6 4 xx = thousands of automatic weaponsyy = murders per 100,000 residentsThis data can be modeled by the equation ˆy=0.89x+3.89.y^=0.89x+3.89. Use this equation to answer the following;Note: Verify this equation using your calculator.A) How many murders per 100,000 residents can be expected in a state with 2.8 thousand automatic weapons?Answer = Round to 3 decimal places.B) How many murders per 100,000 residents can be expected in a state with 8.5 thousand automatic weapons?Answer = Round to 3 decimal places.The table below shows the number of state-registered automatic weapons and the murder rate for several Northwestern states. xx 11.9 8.3 6.9 3.9 2.7 2.4 2.1 0.7 yy 14.3 11.3 10 7.4 6.5 6.4 5.9 4.9 xx = thousands of automatic weaponsyy = murders per 100,000 residentsThis data can be modeled by the equation y=0.84x+4.23. Use this equation to answer the following;Special Note: I suggest you verify this equation by performing linear regression on your calculator.Use the equation with the values rounded to two decimal places to make your predictions.A) How many murders per 100,000 residents can be expected in a state with 5.5 thousand automatic weapons?Answer = Round to 3 decimal places.B) How many murders per 100,000 residents can be expected in a state with 3.9 thousand automatic weapons?Answer = Round to 3 decimal places.
- 6) The line of best fit through a set of data isy=36.704+0.985xy=36.704+0.985xAccording to this equation, what is the predicted value of the dependent variable when the independent variable has value 30?y = Round to 1 decimal place.The table below shows the number of state-registered automatic weapons and the murder rate for several Northwestern states. xx 11.4 8.5 6.6 3.5 2.7 2.3 2.4 0.4 yy 13.9 11.1 9.4 7.3 6.3 5.8 6.1 4.2 xx = thousands of automatic weaponsyy = murders per 100,000 residentsThis data can be modeled by the equation y=0.86x+3.95.y=0.86x+3.95. Use this equation to answer the following;A) How many murders per 100,000 residents can be expected in a state with 7 thousand automatic weapons?Answer = Round to 3 decimal places.B) How many murders per 100,000 residents can be expected in a state with 9.4 thousand automatic weapons?Answer = Round to 3 decimal places.The table below shows the number of state-registered automatic weapons and the murder rate for several Northwestern states. x 11.9 8.6 7.1 3.8 2.3 2.3 2.2 0.3 y 14.3 11 9.9 7.3 5.7 5.7 5.6 4.1 x = thousands of automatic weaponsy = murders per 100,000 residentsThis data can be modeled by the equation y=0.87x+3.75. Use this equation to answer the following; Special Note: I suggest you verify this equation by performing linear regression on your calculator.A) How many murders per 100,000 residents can be expected in a state with 5 thousand automatic weapons?Answer = Round to 3 decimal places.B) How many murders per 100,000 residents can be expected in a state with 10.5 thousand automatic weapons?Answer = Round to 3 decimal places.
