Given are five observations for two variables, and y. Excel File: data14-25.xlsx xi Yi 0.9726 2 7 The estimated regression equation is ý = 7.6 +0.9x. a. What is the value of the standard error of the estimate (to 4 decimals)? 6 9 18 9 26 13 20 23
Given are five observations for two variables, and y. Excel File: data14-25.xlsx xi Yi 0.9726 2 7 The estimated regression equation is ý = 7.6 +0.9x. a. What is the value of the standard error of the estimate (to 4 decimals)? 6 9 18 9 26 13 20 23

Chapter4: Linear Functions
Section: Chapter Questions
Problem 30PT: For the following exercises, use Table 4 which shows the percent of unemployed persons 25 years or...

Related questions
Question
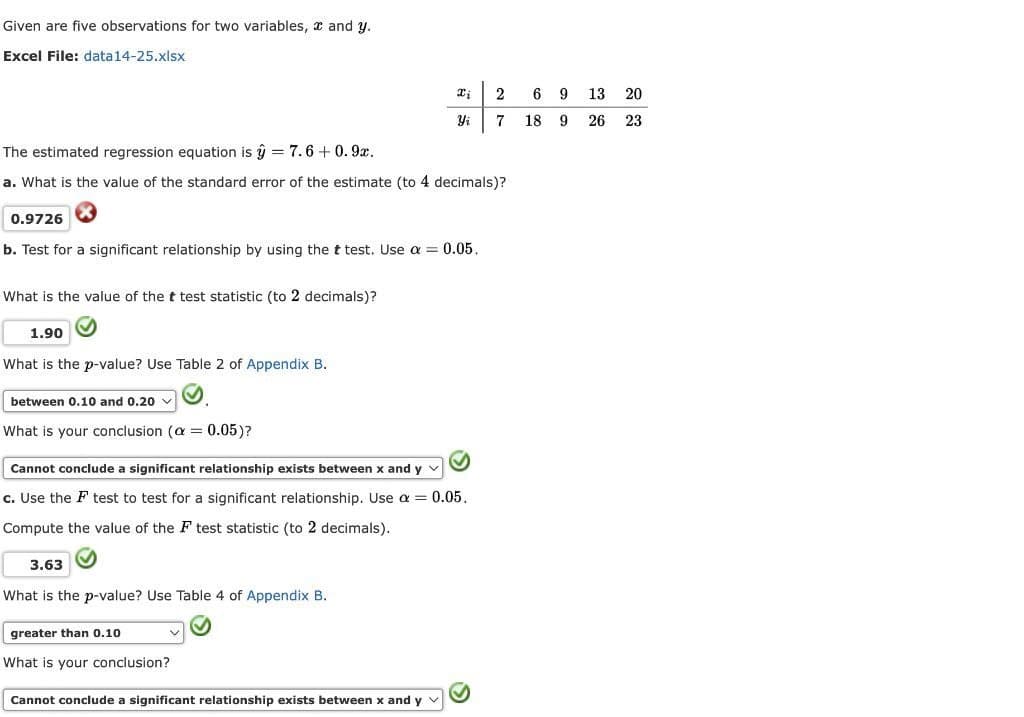
Transcribed Image Text:Given are five observations for two variables, and y.
Excel File: data14-25.xlsx
The estimated regression equation is ŷ = 7.6 +0.9x.
a. What is the value of the standard error of the estimate (to 4 decimals)?
0.9726
b. Test for a significant relationship by using the t test. Use a = 0.05.
What is the value of the t test statistic (to 2 decimals)?
1.90
What is the p-value? Use Table 2 of Appendix B.
between 0.10 and 0.20
What is your conclusion (a = 0.05)?
Xj
Yi
Cannot conclude a significant relationship exists between x and y
c. Use the F test to test for a significant relationship. Use a = 0.05.
Compute the value of the F test statistic (to 2 decimals).
3.63
What is the p-value? Use Table 4 of Appendix B.
greater than 0.10
What is your conclusion?
Cannot conclude a significant relationship exists between x and y
2
7
6
18
9 13
9
20
26 23
Expert Solution
This question has been solved!
Explore an expertly crafted, step-by-step solution for a thorough understanding of key concepts.

Step by step
Solved in 2 steps

Recommended textbooks for you

College Algebra
Algebra
ISBN:
9781305115545
Author:
James Stewart, Lothar Redlin, Saleem Watson
Publisher:
Cengage Learning

Functions and Change: A Modeling Approach to Coll…
Algebra
ISBN:
9781337111348
Author:
Bruce Crauder, Benny Evans, Alan Noell
Publisher:
Cengage Learning
College Algebra
Algebra
ISBN:
9781305115545
Author:
James Stewart, Lothar Redlin, Saleem Watson
Publisher:
Cengage Learning
Functions and Change: A Modeling Approach to Coll…
Algebra
ISBN:
9781337111348
Author:
Bruce Crauder, Benny Evans, Alan Noell
Publisher:
Cengage Learning

Algebra and Trigonometry (MindTap Course List)
Algebra
ISBN:
9781305071742
Author:
James Stewart, Lothar Redlin, Saleem Watson
Publisher:
Cengage Learning