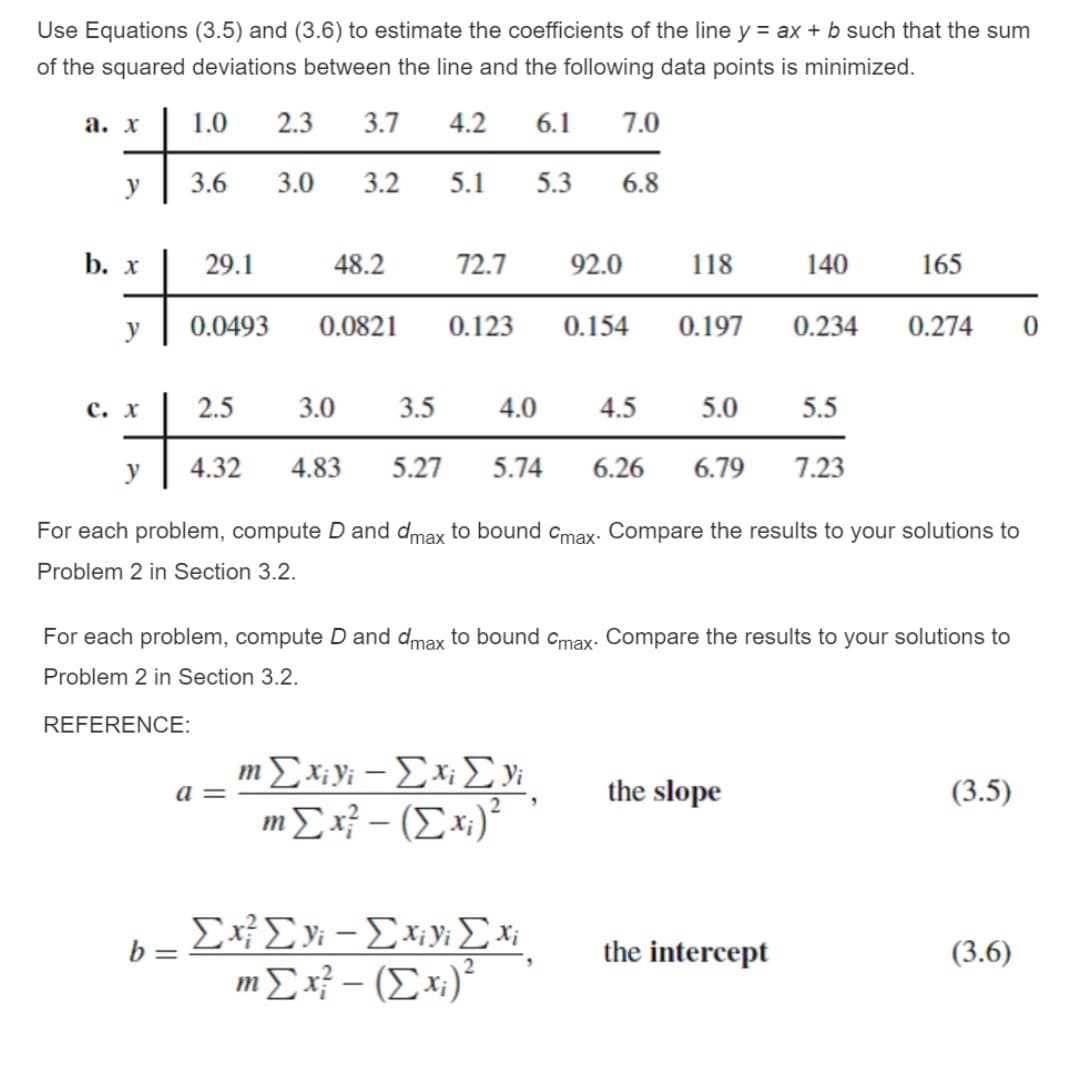
Use Equations (3.5) and (3.6) to estimate the coefficients of the line y = ax + b such that the sum of the squared deviations between the line and the following data points is minimized. a. x 1.0 2.3 3.7 4.2 6.1 7.0 y 3.6 3.0 3.2 5.1 5.3 6.8


Q: A medical researcher wishes to see whether there is a relationship between a person’s age,…
A: Given that A medical researcher wishes to see whether there is a relationship between a person’s…
Q: Suppose that the weight of an newborn fawn is Uniformly distributed between 2.3 and 3 kg. Suppose…
A:
Q: Suppose the National Transportation Safety Board (NTSB) wants to examine the safety of compact…
A: The question is about ANOVA Given :
Q: Can you explain: P(M^c ) union P(R)= P(M^c) +P(R) I thought this was true for only mutually…
A:
Q: The data were collected from a statistics class. The column heads give the variable, and each of the…
A: Solution-: We want to find the how many variables are in the data collected in given table.
Q: Find the critical values x²₁ and x²R for the given confidence level c and sample size n. L c=0.8, n…
A:
Q: The data in the accompanying table were collected from a statistics class. The first row gives the…
A: This table contains the living situation of students ,but not contains no: of hours of study per…
Q: Social Survey is an annual survey given to about 1500 U.S. adults selected at random. A recent…
A:
Q: Suppose in a certain state there were 40 tornadoes in the last 25 years. Using the Poisson…
A:
Q: A college freshman need to take a 100 level Math and English plus optional Philosophy course. In…
A: The answer is attached below,
Q: An economist wants to test if there is any difference in income between Escambia county and…
A: From the provided information,
Q: A pearson test statistic of .876 with a criticial valur of 0.361 would suggest what: A.…
A:
Q: Suppose that the weight of an newborn fawn is Uniformly distributed between 2.3 and 3 kg. Suppose…
A:
Q: What is the normal duration of the project in weeks? * Activity Contract Preceding Normal Amount…
A:
Q: The diameters of bolts produced in a machine shop are normally distributed with a mean of 5.7…
A: GivenMean(μ)=5.7standard deviation(σ)=0.08
Q: distributed. Use calculator program to find the 99% confidence interval for μd
A: Given : Student 1 2 3 4 5 6 Test A 121 93 71 119 104 100 Test B 121 91 72 122 108 100
Q: I want to get you thinking further about the differences between samples and populations. Suppose…
A: Population: The population comprises all of the records along with quantifiable population…
Q: For a non-parametric between sample analysis, you use: A. Wilcoxon B. Paired t-test C. Mann…
A: The objective is to identify the non-parametric test between two samples:
Q: Españo An adventure company runs two obstacle courses, Fundash and Coolsprint, with similar designs.…
A:
Q: to check the normality test using shapiro-wilk, if the p-valued is more than 0.05?
A: Shapiro-Wilk Test H0: The population is normal Against H1: The population is not normal if p value…
Q: within the outpout attachted, define what analysis has been conducted and report the regression…
A: Anova is used to measure the mean significance between the three or more groups. It explains the…
Q: Dr G is conducting a research on the number of hours students spend studying Statistics. He selects…
A: The question is about sample size estimation Given : Popl. std. deviation ( σ ) = 2.3 hours Pop.…
Q: a- If a students is chosen randomly, what is the probability that he or she is not in any of these…
A: here from given information define events and draw venn diagram E = student taking english class…
Q: Let Y~N(4,4), and Z=((Y-4)/4) is a standard normal random variable. O True False
A: Answer : - Given Y ~ N(4,4) and Z = y-44 is a standard normal random variable…
Q: 1. A set of hypotheses is important before conducting path analysis because the analysis cannot…
A: Path analysis is a type of multiple regression analysis. It explain the relationship between the…
Q: Sample 1 n1 = 20 x₁ = = 22.7 S₁ = 2.6 $1 Sample 2 72 = 30 x₂ = 20.1 $₂ = 4.4
A: Given,For sample 1 :sample size (n1) =20sample mean (x̄1) = 22.7sample standard deviation (s1) =…
Q: A pharmaceutical company sells a tablet for treating colds. After extensive experimentation,…
A: Note: According to Bartleby guidelines expert solve only one question and maximum 3 subpart of the…
Q: 22 17 29 36 42 24 24 25 99% CI for the standard deviation of the coating layer thickness…
A: Given 22,17,29,36,42,24,24,25
Q: The average weight of insects for a laboratory experiment is 13.2 g with a standard deviation of 0.8…
A: From z tables, we get the p value
Q: A supervisor at an electric bulb factory examines bulbs produced in the factory for defects. She…
A: Given problem is poisson distribution Let X: defective bulbs 14 defective bulbs in a week 1 weak = 7…
Q: 40. What is the appropriate set of hypotheses if we decided to test for the significance of the…
A: The objective is to find the most appropriate regression coefficient from the given options.
Q: A certain forum reported that in a survey of 2008 American adults, 24% said they believed in…
A:
Q: Match the following parametric and its corresponding non parametric test. Parametric - 1.…
A: An Independent t test is used to compare the means of two populations when standard deviation is…
Q: The graph shows ages of females (labeled 1) and males (labeled 0) who are majoring in psychology in…
A: Given that: In a graph: Ages of Females are labelled as 1 Ages of Male are labelled as 0
Q: GRC students who took a Proficiency Exam had a μ-84 and o=6 Find X such that 5% of the mean Exam…
A: GivenMean(μ)=84standard deviation(σ)=6sample size(n)=16
Q: Test a claim that the mean amount of carbon monoxide in the air in U.S. cities is less than 2.31…
A: Disclaimer: Since you have posted a question with multiple sub-parts, we will solve the first three…
Q: What does the result of sig. value indicate? pick the correct letter. a. variances of the…
A: We have to choose the correct option regarding the statement "what does the result of sig. value…
Q: According to analysis of variance, there are assumptions to follow when choosing the right…
A: Given:Violation of assumption (test of homogeneity) of ANOVA test then we can use then we can use…
Q: The incomes of a certain large population of electricians follow a Normal distribution with mean…
A: Consider that the mean and standard deviation of a random variable X are µ and σ, respectively.…
Q: The following data represents the times it took some rats to complete a maze (in seconds). 64, 70,…
A: The provided data are in ascending order 58,63,64,68,69,70,72,75,76,81,81,86 n=12 a.The mean is…
Q: In a study 10 people were given a test. The mean test score was 78.9 points. The standard deviation…
A: Given: Sample size n = 10 Sample mean X = 78.9 Sample standard deviation s = 5.2 Formula Used: X =…
Q: Construct the joint probability mass table of (X,Y)
A: here given , there are total 52 cards in deck 5 cards are selected without replacement X= number…
Q: Write the statement showing the relationship between the two variables.
A: 1. From the scatterplot 1 The scatterplot shows the negative relationship between two variables If…
Q: Test the hypothesis using the P-value approach. Be sure to verify the requirements of the test. Ho…
A: Given n=100 P=0.3 X=40
Q: Samantha is taking Statistics and Psychology classes during this summer session. She received a…
A: It is given that: For statistics:Raw score=85, μSmean score=75, σSSD of scores=8For psychology:Raw…
Q: Suppose that the walking step length of an adult males are normally distributed with a mean of 2.5ft…
A: The mean is 2.5 and the standard deviation is 0.5.
Q: ov states there are 15,058,670 acres of farmland in Indiana. If approximately 65% of Indiana is…
A: There are 15,058,670 acres of farmland in Indiana. Given,it is 65% of total land in Indiana…
Q: The increasing annual cost (including tuition, room, board, books, and fees) to attend college has…
A: Given: For private college: n1 = 10 For public college: n2 = 12 Formula Used: Sample Mean X = ∑Xin…
Q: Suppoose the p-value for a hypothesis is 0.0305. Using a 0.05, what is the appropriate conclusion?…
A:
Q: 21. Suppose all assumptions for the parametric test was satisfied. The appropriate test procedure to…
A: Solution :- Option :- B. t test for independent samples Here the given two groups Regular and Not…


Trending now
This is a popular solution!

Step by step
Solved in 3 steps with 2 images

- Determine the best (according to sum-of-squares-measure) curve y = Aebx , through the data above. Transformed equation ln(y) = ln(A) + bx or Y = a + bx.Carrie and Ryan have both computed the slope of the least-squares line using data for which the standard deviation of the x-values and the standard deviation of the y-values are equal. Carrie gets a value of 0.5 for the slope, and Ryan gets a value of 2. One of them is right. Which one?Two types of feed have been developed for a freshwater fish raised in fish farms. 40 of the fish fed with the first feed and 50 of the fish fed with the second feed were randomly selected and average weight gains were found to be 175 gr and 130 gr, respectively. Which of the following is the point estimate of the difference in average weight gain of fish fed two feeds?
- The least-squares regression equation is y=728.0x+14,705 where y is the median income and x is the percentage of 25 years and older with at least a bachelor's degree in the region. The scatter diagram indicates a linear relation between the two variables with a correlation coefficient of 0.8165. For every dollar increase in median income, the percent of adults having at least a bachelor's degree is ___%, on average. For a median income of $0, the percent of adults with a bachelor's degree is ____%.Determine the best (according to sum-of-squares-measure) curve y = Axb, through the data above. Transformed equation ln(y) = ln(A) + b ln(x) or Y = a + bX.Determine the best (according to sum-of-squares-measure) curve y = Aebx, through the dataabove.Transformed equationln(y) = ln(A) + bxorY = a + bx.
- A value of r close to _______ suggests at most a weak linear relationship between the variables.Q9: Assume that a researcher wants to estimate the proportion of “A” grade scorers in STAT101 course for the population of SEU students in 2020. Assume also that the proportion of “A” grade scorers in 2020 is not known. How many SEU students must be surveyed from STAT101 course in order to be 90% confident and the margin of error should not exceed two percentage points? (Given zα/2 = 1.64). 1- 1821 2- 1781 3- 1618 4- 1681(A) The linearity between two variables X and Y, in pairs, defined as X=[4,2,3,5,2,4] and Y=[6,4,6,8,5,10] is equal to? (B)An outbreak of certain illness was attributed to ice creams produced at a certain factory. Scientists measured the level of the illness causing factor in 10 randomly sampled batches of ice cream. The levels were: 0.583, 0.242, 0.129, 0.691, 0.231, 0.693, 0.619, 0.392, 0.418. What is the estimated interval of population mean at 0.05 level of significance? (C) The population standard deviation for the age of a certain University students is 13 years. If we want to be 90% confident that the sample mean age is within 3 years of the true population mean age of the University students, then how many randomly selected students must be surveyed?
- The equation of the line containing the points (−2,−4) and (2,5) is y=2.25x+0.5. Compute the sum of the squared residuals of the given data set for this line. The sum of the squared residuals for the line containing the points (−2,−4) and (2,5) isA regression of the amount of calories in a serving of breakfast cereal vs. the amount of fat in the cereal gave the following results: Calories = 97.1053 + 9.6525*(grams of fat). Which of the following is FALSE: It is estimated that for every additional gram of fat in the cereal, the number of calories increases by about 9. It is estimated that in cereals with no fat, the total amount of calories is about 97. If a cereal has 2 g of fat, then it is estimated that the total number of calories is about 113. If a cereal has about 145 calories, then this equation indicates that it has about 5 grams of fat. One cereal has 140 calories and 5 g of fat. Its residual is about 5 cal.A college bookstore must order books two months before each semester starts. They believe that the number of books that will ultimately be sold for any particular course is related to the number of students registered for the course when the books are ordered. They would like to develop a bestfitting line to predict how many books to order. From past records, the bookstore obtains the number of students registered, X, and the number of books actually sold for a course, Y , for 12 different semesters.A scatterplot of the data along with the best fitting line is presented below. a. The correlation between the two variables is r = .89. Calculate and interpret the value of r2.b. The equation for the best fitting line is Y = 9.30 + 0.673X. Explain and interpret the value of 9.30.c. How many books should the store order for a class of 50 students? Would you trust this prediction?