. To evaluate the accuracy of a new analytical method, an analyst determines the purity of a tandard for whichµ is 100.0%, obtaining the following results.
Q: Find the area under the standard normal curve that lies to the right of 0.66.
A:
Q: A population consists of the numbers 2, 4, 5, 9, 10. List all possible sample size of 3 from this…
A: "Since you have posted a question with multiple sub-parts, we will solve the first three sub-parts…
Q: Determine the nominal, ordinal, interval or ratio data. b. Determine if the given data is discrete…
A: The variable region, province and highly urbanized city is nominal data set. Nominal data…
Q: 3.1. A manufacturing company regularly conducts quality control checks at specified periods on all…
A: It is given that n=4 and p=0.15.
Q: rug is used to help prevent blood clots in certain patients. In clinical trials, among 4999 patients…
A:
Q: Two methods of measuring surface smoothness are used to evaluate a paper product. The measurements…
A:
Q: In a simple random sample of size 60, there were 39 individuals in the category of interest. Part:…
A: From the provided information, Sample size (n) = 60 From which 39 individuals in the category of…
Q: What is the relationship between the amount of time statistics students study per week and their…
A: Note: According to Bartleby expert guidelines, we can answer only first question with their three…
Q: table below gives the age and bone density for five randomly selected women. Using this data,…
A: Given that ; X represent the Age Y represent the bone density Age 39 41 51 58 67 Bone Density…
Q: Use the standard normal table to find the area to the left of z=−3.21. The area to the left of…
A:
Q: Estimate the probability that a person who walks by the store will come in and buy something
A: here given , John runs a computer software store. He counted 120 people who walked by his store in…
Q: Lif we are testing for the difference between two population means, it is assumed that the sample…
A: Assumptions of the hypothesis testing 1. Assumptions of homogeneity is that the population…
Q: re interested in studying cigarette demand by young adults. Lets consider the following model: ncaj…
A: Given: The regression line is ncaj = β0 + β1price + β2age + β3income + u ncaj is monthly cigarette…
Q: fc(c) = | 16| fA,B(cb, b) db. v that if Z ~ N(0, 1) and Y ~ x²(n) with Z an Z T = ~ t(n).
A: *Answer:
Q: In an assembly line production using industrial robots, a particular component can be installed on…
A: Given information, There are 20 components. Among 20 components, 2 are improperly drilled holes and…
Q: A state lottery randomly chooses 5 balls numbered from 1 through 42 without replacement. You choose…
A: Given that 5 tickets are purchased from lottery tickets Lottery tickets number from 1 to 42
Q: You wish to determine if there is a linear correlation between the age of a driver and the number of…
A: Use EXCEL to obtain the value correlation coefficient r: EXCEL procedure: Go to EXCEL Go to…
Q: 6. Hours Slept 6.5 8.25 7.5 7.25 7.25 7.5 6.5 7.75 5.25 7.75 7 6.75 6.25 7.5 7 7.25 6.75 7.5 6.75 6…
A: Solution-: Given data of hour slept. We want to find, (a) n=?,x¯=?,s=? (b) 5 number summary (c)…
Q: A physician is interested to determine if the mean length of waiting time to conceive (in months) of…
A: Independent samples: Two samples are said to be independent when observations in one sample do not…
Q: The teacher picks one index card out of 20 students for graded recitation. Select the correct…
A: 1. Teacher picks one index card out of 20 students. Hence probability selecting one index card out…
Q: The survey of 523 students showed that 141 first year engineering students were willing to enroll…
A: Given n1=523, n2=477, X1=141, X2=81 , level of significance ɑ=0.01
Q: Data was collected for 300 fish from the North Atlantic. The length of the fish (in mm) is…
A: Given that Frequency distribution table Lengths (mm) Frequency 140 - 141 1 142 -…
Q: The probability of getting 7 or more heads when flipping a coin 10 times is ________. The…
A:
Q: (a) If researchers decide on a 4.5% margin of error for a 95% confidence interval. What sample size…
A: Here given, Before conducting a study it is often a good idea to decide on the necessary sample…
Q: Suppose they conducted another set of experiment with increased sample size and saw that the three…
A: Given Information: Consider the matrix of HSD's test result for the experiment. Treatments Mean…
Q: The average temperature in Anchorage, Alaska, in January is 21'F with a standard deviation of 10°.…
A: For Anchorage, μ=21σ=10 Consider, the probability that the temperature in a January with a high of…
Q: You are conducting a multinomial hypothesis test for the claim that the 4 categories occur with the…
A: Expected frequency= Σfi/n Where fi's are frequencies and n is number of categories. Squared…
Q: 4. Sketch the graph of the following p.d.f. Also, find and sketch the graphs of the distribution…
A:
Q: Complete parts (a) and (b) below. The number of dogs per household in a small town Dogs 1 2 3 4…
A: Dogs(X) 0 1 2 3 4 5 P(x) 0.632 0.232 0.088 0.026 0.014 0.008
Q: a teacher wants to explore what type of activities worked best for the class. the class o 40 was…
A: Hi, there! As per the norms, we are allowed to solve three subparts at a time. Kindly repost the…
Q: A researcher wonders whether males get paid more, on average, than females at a large firm. She…
A: Hello! As you have posted more than 3 sub parts, we are answering the first 3 sub-parts. In case…
Q: The time it takes for the workers to carry out the same assembly is normally distributed with a mean…
A: GivenMean(μ)=30.5standard deviation(σ)=5
Q: True or False Consider the following model, Yi = β0 + β1Xi + ui,E[ui|Xi] = 0,i = 1,...,n…
A: Solution: As per the guidelines first three parts should be answered.
Q: Statistics: Design and Analysis with Several Factors - 22 Design of Experiment Assume that four…
A: From the given information, the output of the given question is attached below. 1) The sum of…
Q: A random variable Y is said to have a Singh-Maddala distribution with parameter θ > 0 if the density…
A:
Q: Consider a normal population with u = 46 and O = 4.5. Calculate the z-score for an x of 46.2 from a…
A: From the provided information, Population mean (µ) = 46 Standard deviation (σ) = 4.5 X~N (46, 4.5)
Q: You are given: (i) 1 for 0Sx <110. 110-x (ii) 8=0.05 Find 19 A20.
A: Given μx=1110-x for 0≤x<110 δ=0.05
Q: In a hypothesis test with the null and alternative hypotheses Ho: u 45, a random sample of 69…
A:
Q: you can reject H0 at the 1% level of significance, can you always reject H0 for a two-tailed test at…
A: We have given that the decision for one-tailed test.
Q: (a) Find the mean, variance, and standard deviation of the probability distribution. The mean is…
A: We have given that the probability distribution table. The random variable X i.e, defects. Mean =…
Q: The CDF of a random variable Y that is discrete is stated by the image attached below. Find the PMF…
A: The CDF is defined as F(x) = P(X ≤ x) And the probability at a point by using CDF can be calculated…
Q: A random sample of 30 basketball players were collected and their body temperatures were measured.…
A: Solution
Q: You intend to conduct a test of independence for a contingency table with 6 categories in the column…
A: Given,no.of categories in the column variable(c)=6no.of categories in the row variable(r)=5
Q: 3. The table below gives the populations of four districts A, B, C, and D, among which a total of 2…
A:
Q: Use the expression in the accompanying discussion of sample size to find the size of each sample if…
A:
Q: The U.S. Census Bureau reported in that, people annual income for people who never married was…
A: Given that Sample size n =100 , for each group.
Q: There are 17 students in a class and seven of them will be chosen to go on a field trip how many…
A: It is given that Total number of students n = 17 Students to be selected r = 7
Q: Use Linear Regression to fit a straight line to the data shown. Show your manual solution…
A: Solution-: Given data: X Y 0 2.9 1 3.7 2 4.1 2.5 4.4 3 5 We find the equation of…
Q: 1. A man has 5 different suits, 7 different shirts and 4 different pairs of shoes. In how many ways…
A: here use counting principle
Q: uestion Review(41c): A researcher was interested in the effect of outdoor acitivity on mood.She…
A: Regression Analysis: A researcher uses a regression analysis model to predict the dependent or…
Please do this on MS EXCEL. Please show the step by step process on EXCEL. So I can use it as a guide. Thank you.
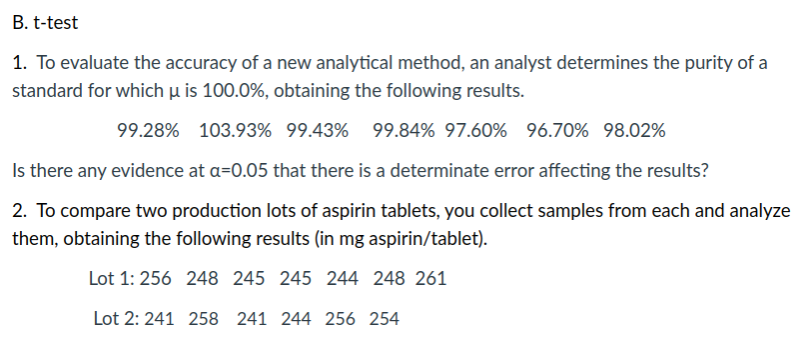
Step by step
Solved in 2 steps
- Note- bolded quiz have already answered A possible important environmental determinant of lung function in children is the amount of cigarette smoking in the home. Suppose this question is studied by selecting two groups: Group 1 consists of 23 nonsmoking children 5-9 years of age, both of whose parents smoke, who have a mean forced expiratory volume (FEV) of 2.1 L and a standard deviation of 0.7 L; group 2 consists of 20 nonsmoking children of comparable age, neither of whose parents smoke, who have a mean FEV of 2.3 L and a standard deviation of 0.4 L.*8.31 What are the appropriate null and alternative hypotheses to compare the means of the two groups? *8.32 What is the appropriate test procedure for the hypotheses in Problem 8.31? *8.33 Carry out the test in Problem 8.32 using the criticalvalue method. *8.34 Provide a 95% CI for the true mean difference in FEV between 5- to 9-year-old children whose parents smoke and comparable children whose parents do not smoke. *8.35 Assuming…A Sociologist wishes to see whether the number of years of schooling a person has is dependent on the person’s location. The information is classified as follows: Location No education Four-year degree Advanced degree Total Metropolis 15 12 8 35 Suburban 8 15 9 32 Countryside 6 8 7 21 Total 29 35 24 88 At alpha 0.05, can the Sociologist conclude that a person’s location is dependent on the number of years of schooling? Find p-value and on the basis of the p-value, should the null hypothesis be rejected?If the value of Cronbach’s alpha is 0.07, it means ___________; a. Research instrument is not reliable b. Research instrument is internally consistent c. Data is reliable d. Data is internally consistent
- Suppose that we want to compare the cleansing action of three detergents on the basis of the following whiteness readings made on 15 swatches of white cotton cloth, first soiled with motor oil and then washed in an agitator-type washing machine: If the tabular values of F are 3.89 and 6.93 at 5% and 1% level of significance, what is the appropriate decision? (note: CRD). (show your solution) choices of correct answer: a. No significant difference b. Significant at 5% c. Highly significant at 1% d. Not significant at 1%In a typical multiple linear regression model where x1 and x2 are non-random regressors, the expected value of the response variable y given x1 and x2 is denoted by E(y | 2,, X2). Build a multiple linear regression model for E (y | *,, *2) such that the value of E(y | x1, X2) may change as the value of x2 changes but the change in the value of E(y | X1, X2) may differ in the value of x1 . How can such a potential difference be tested and estimated statistically?Resistors labeled as 100 Ω are purchased from two different vendors. The specification for this type of resistor is that its actual resistance be within 5% of its labeled resistance. In a sample of 180 resistors from vendor A, 150 of them met the specification. In a sample of 270 resistors purchased from vendor B, 233 of them met the specification. Vendor A is the current supplier, but if the data demonstrate convincingly that a greater proportion of the resistors from vendor B meet the specification, a change will be made. a) State the appropriate null and alternate hypotheses. b) Find the P-value. c) Should a change be made?
- The Head of production at Amiba private limited needed to examine the key determinants of company profitability($,000). So, he collected relevant(monthly) data and following is the summary of his regression output. SUMMARY OUTPUT Regression Statistics Multiple R 0.5776 R Square 0.3336 Adjusted R Square 0.2670 Standard Error 2.2743 Observations 34 ANOVA df SS MS F Significance F Regression 3 77.6774 25.8925 5.0060 0.0062 Residual 30 155.1693 5.1723 Total 33 232.8467 Coefficients Standard Error t Stat P-value Lower 95% Upper 95% Lower 95.0% Upper 95.0% Intercept 10.49 2.9211 3.5927 0.0012 4.5291 16.4605 4.5291 16.4605 Variable X 0.99 1.2461 0.7937 0.4336 -1.5559 3.5340 -1.5559 3.5340 Variable Y 2.56 1.1291 2.2663 0.0308 0.2529 4.8648 0.2529 4.8648 Variable Z 2.06…The Head of production at Amiba private limited needed to examine the key determinants of company profitability($,000). So, he collected relevant(monthly) data and following is the summary of his regression output. SUMMARY OUTPUT Regression Statistics Multiple R 0.5776 R Square 0.3336 Adjusted R Square 0.2670 Standard Error 2.2743 Observations 34 ANOVA df SS MS F Significance F Regression 3 77.6774 25.8925 5.0060 0.0062 Residual 30 155.1693 5.1723 Total 33 232.8467 Coefficients Standard Error t Stat P-value Lower 95% Upper 95% Lower 95.0% Upper 95.0% Intercept 10.49 2.9211 3.5927 0.0012 4.5291 16.4605 4.5291 16.4605 Variable X 0.99 1.2461 0.7937 0.4336 -1.5559 3.5340 -1.5559 3.5340 Variable Y 2.56 1.1291 2.2663 0.0308 0.2529 4.8648 0.2529 4.8648 Variable Z 2.06…For some genetic mutations, it is thought that the frequency of the mutant gene in men increases linearly with age. If m1 is the frequency at age t1, and m2 is the frequency at age t2, then the yearly rate of increase is estimated by r = (m2 − m1)/(t2 − t1). In a polymerase chain reaction assay, the frequency in 20-year-old men was estimated to be 17.7 ± 1.7 per μgDNA, and the frequency in 40-year-old men was estimated to be 35.9 ± 5.8 per μg DNA. Assume that age is measured with negligible uncertainty.a) Estimate the yearly rate of increase, and find the uncertainty in the estimate.b) Find the relative uncertainty in the estimated rate of increase.
- You conduct a regression of the squared residuals against the dummy variables X1, X2, and X3 and find that for the squared residuals regression: Multiple R 0.4145 R Square 0.1718 Adjusted R Square 0.1600 SEE 92.3760 Conduct a test at the level to see if conditional heteroskedasticity is present In view of your answer for a), what needs to be done?Do you think E(y)=β0+β1 ln|x|+ β2ex+β3x3 is a linear statistical model What about E(y)=β0+β1x1+eβ2x2 ?Resistors labeled as 100 Ω are purchased from two different vendors. The specification for this type of resistor is that its actual resistance be within 5% of its labeled resistance. In a sample of 180 resistors from vendor A, 149 of them met the specification. In a sample of 270 resistors purchased from vendor B, 233 of them met the specification. Vendor A is the current supplier, but if the data demonstrate convincingly that a greater proportion of the resistors from vendor B meet the specification, a change will be made. P-value?