. What quantity does the slope of your graph represent? Explain in words and using ations.
. What quantity does the slope of your graph represent? Explain in words and using ations.

Algebra & Trigonometry with Analytic Geometry
13th Edition
ISBN:9781133382119
Author:Swokowski
Publisher:Swokowski
Chapter6: The Trigonometric Functions
Section6.6: Additional Trigonometric Graphs
Problem 60E

Related questions
Question
I need help with questions #11, #12, and #13?
Thank you!
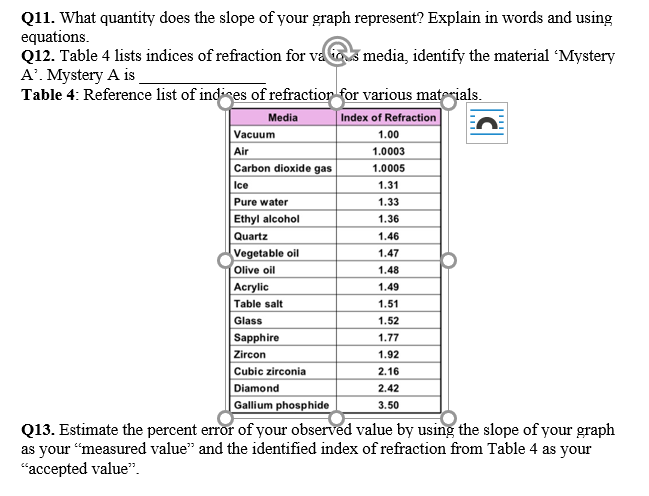
Transcribed Image Text:Q11. What quantity does the slope of your graph represent? Explain in words and using
equations.
Q12. Table 4 lists indices of refraction for vas media, identify the material Mystery
A'. Mystery A is
Table 4: Reference list of indises of refraction for various matesials.
Media
Index of Refraction
Vacuum
1.00
Air
1.0003
Carbon dioxide gas
1.0005
Ice
1.31
Pure water
1.33
Ethyl alcohol
1.36
Quartz
1.46
Vegetable oil
Olive oil
1.47
1.48
Acrylic
1.49
Table salt
1.51
Glass
1.52
Sapphire
1.77
Zircon
1.92
Cubic zirconia
2.16
Diamond
2.42
Gallium phosphide
Q13. Estimate the percent error of your observed value by using the slope of your graph
as your "measured value" and the identified index of refraction from Table 4 as your
3.50
"accepted value".
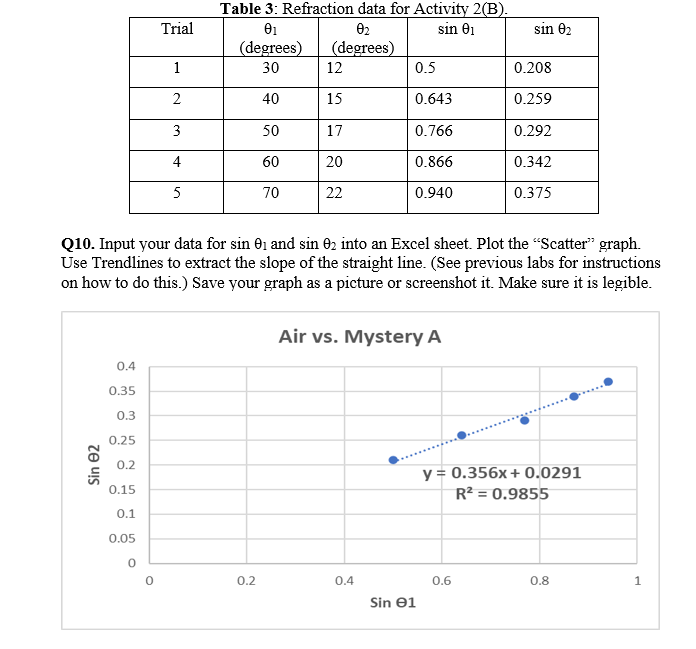
Transcribed Image Text:Table 3: Refraction data for Activity 2(B).
02
(degrees)
Trial
sin 01
sin 02
(degrees)
1
30
12
0.5
0.208
2
40
15
0.643
0.259
3
50
17
0.766
0.292
4
60
20
0.866
0.342
5
70
22
0.940
0.375
Q10. Input your data for sin e1 and sin 02 into an Excel sheet. Plot the "Scatter" graph.
Use Trendlines to extract the slope of the straight line. (See previous labs for instructions
on how to do this.) Save your graph as a picture or screenshot it. Make sure it is legible.
Air vs. Mystery A
0.4
0.35
0.3
0.25
0.2
y = 0.356x+ 0.0291
R? = 0.9855
0.15
0.1
0.05
0.2
0.4
0.6
0.8
Sin e1
Sin 02
Expert Solution
This question has been solved!
Explore an expertly crafted, step-by-step solution for a thorough understanding of key concepts.

Step by step
Solved in 3 steps

Recommended textbooks for you
Algebra & Trigonometry with Analytic Geometry
Algebra
ISBN:
9781133382119
Author:
Swokowski
Publisher:
Cengage

Trigonometry (MindTap Course List)
Trigonometry
ISBN:
9781305652224
Author:
Charles P. McKeague, Mark D. Turner
Publisher:
Cengage Learning
Algebra & Trigonometry with Analytic Geometry
Algebra
ISBN:
9781133382119
Author:
Swokowski
Publisher:
Cengage
Trigonometry (MindTap Course List)
Trigonometry
ISBN:
9781305652224
Author:
Charles P. McKeague, Mark D. Turner
Publisher:
Cengage Learning