In Shell Pulung Bulu, the yearly data of cars that have been serviced and the gross receipts are shown below. (a) Based on these data, can it be concluded that there is a relationship between the number of cars serviced and the gross receipts? (Use graphing paper for the scatter plot. If you do not have a graphing paper, use a bond paper but make sure that your graph is properly and accurately drawn) No of Serviced Cars, x 361 270 306 22 35 10 8 12 21 Gross receipts (in million pesos), 3844 1962 1371 1064 334 241 188 154 125 y (b) Find y' when x = 0.25. (c) Find the mean of the x and y variables. Then substitute the mean of the x variable into the corresponding regression line equations and find y'. Compare the value of y' with y bar and generalize the results.
In Shell Pulung Bulu, the yearly data of cars that have been serviced and the gross receipts are shown below. (a) Based on these data, can it be concluded that there is a relationship between the number of cars serviced and the gross receipts? (Use graphing paper for the scatter plot. If you do not have a graphing paper, use a bond paper but make sure that your graph is properly and accurately drawn) No of Serviced Cars, x 361 270 306 22 35 10 8 12 21 Gross receipts (in million pesos), 3844 1962 1371 1064 334 241 188 154 125 y (b) Find y' when x = 0.25. (c) Find the mean of the x and y variables. Then substitute the mean of the x variable into the corresponding regression line equations and find y'. Compare the value of y' with y bar and generalize the results.

Glencoe Algebra 1, Student Edition, 9780079039897, 0079039898, 2018
18th Edition
ISBN:9780079039897
Author:Carter
Publisher:Carter
Chapter10: Statistics
Section10.6: Summarizing Categorical Data
Problem 23PPS

Related questions
Question
engineering data analysis
need complete solution no shortcuts pls i need step by step in everything
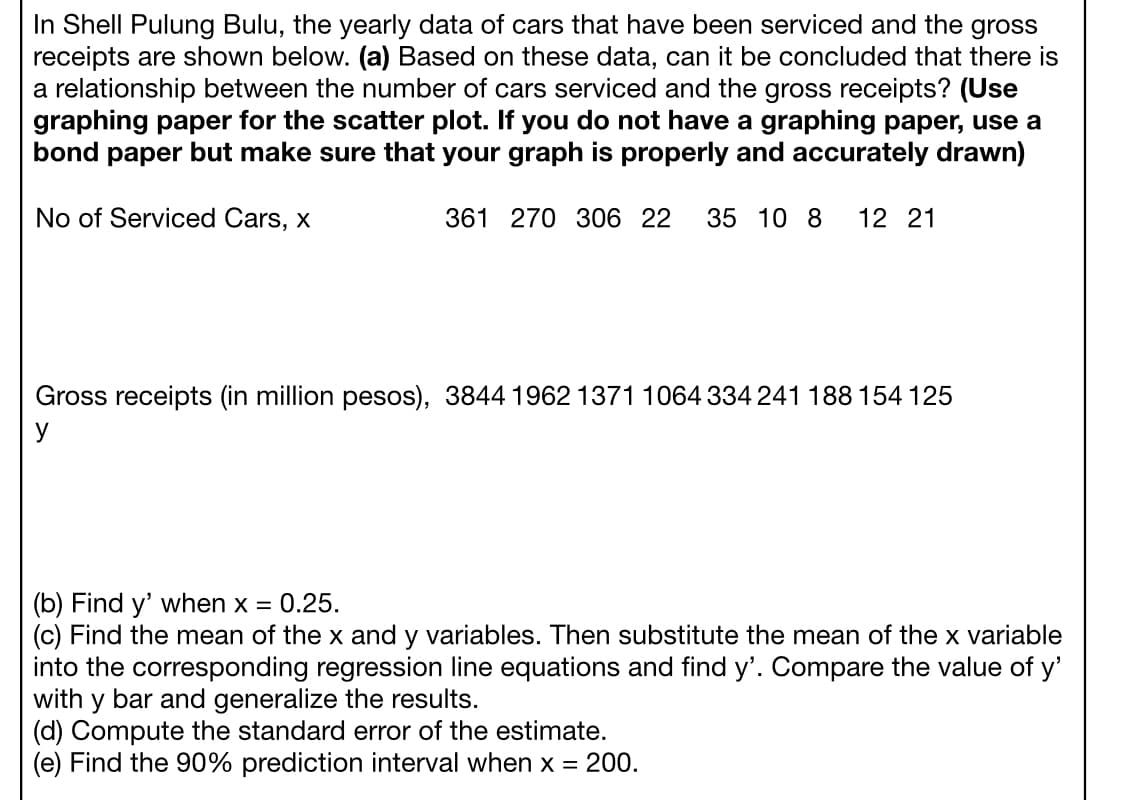
Transcribed Image Text:In Shell Pulung Bulu, the yearly data of cars that have been serviced and the gross
receipts are shown below. (a) Based on these data, can it be concluded that there is
a relationship between the number of cars serviced and the gross receipts? (Use
graphing paper for the scatter plot. If you do not have a graphing paper, use a
bond paper but make sure that your graph is properly and accurately drawn)
No of Serviced Cars, x
361 270 306 22
35 10 8
12 21
Gross receipts (in million pesos), 3844 1962 1371 1064 334 241 188 154 125
(b) Find y' when x = 0.25.
(c) Find the mean of the x and y variables. Then substitute the mean of the x variable
into the corresponding regression line equations and find y'. Compare the value of y'
with y bar and generalize the results.
(d) Compute the standard error of the estimate.
(e) Find the 90% prediction interval when x = 200.
Expert Solution
This question has been solved!
Explore an expertly crafted, step-by-step solution for a thorough understanding of key concepts.

Step by step
Solved in 2 steps

Recommended textbooks for you
Glencoe Algebra 1, Student Edition, 9780079039897…
Algebra
ISBN:
9780079039897
Author:
Carter
Publisher:
McGraw Hill

Big Ideas Math A Bridge To Success Algebra 1: Stu…
Algebra
ISBN:
9781680331141
Author:
HOUGHTON MIFFLIN HARCOURT
Publisher:
Houghton Mifflin Harcourt

Functions and Change: A Modeling Approach to Coll…
Algebra
ISBN:
9781337111348
Author:
Bruce Crauder, Benny Evans, Alan Noell
Publisher:
Cengage Learning
Glencoe Algebra 1, Student Edition, 9780079039897…
Algebra
ISBN:
9780079039897
Author:
Carter
Publisher:
McGraw Hill
Big Ideas Math A Bridge To Success Algebra 1: Stu…
Algebra
ISBN:
9781680331141
Author:
HOUGHTON MIFFLIN HARCOURT
Publisher:
Houghton Mifflin Harcourt
Functions and Change: A Modeling Approach to Coll…
Algebra
ISBN:
9781337111348
Author:
Bruce Crauder, Benny Evans, Alan Noell
Publisher:
Cengage Learning

Holt Mcdougal Larson Pre-algebra: Student Edition…
Algebra
ISBN:
9780547587776
Author:
HOLT MCDOUGAL
Publisher:
HOLT MCDOUGAL

Algebra & Trigonometry with Analytic Geometry
Algebra
ISBN:
9781133382119
Author:
Swokowski
Publisher:
Cengage