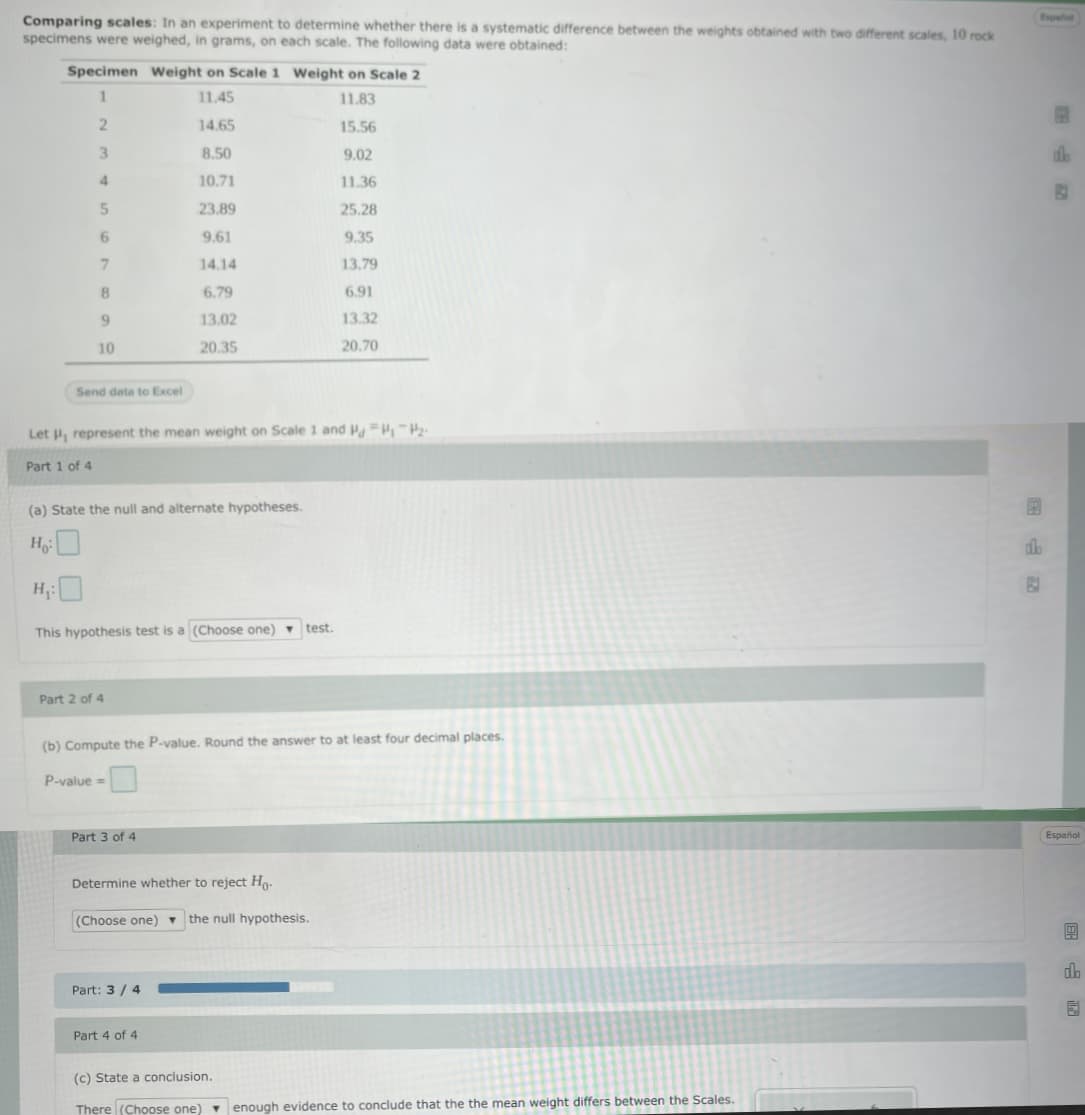
.BmBaFing scales: In an experiment to determine whether there is a systematic difference between the weights obtained with two different scales, 10 rock specimens were weighed, in grams, on each scale. The following data were obtained: Specimen Weight on Scale 1 Weight on Scale 2 11.45 11.83 14.65 15.56 3 8.50 9.02 4 10.71 11.36 23.89 25.28 9.61 9.35 7. 14.14 13.79 6.79 6.91 13.02 13.32 10 20.35 20.70 Send data to Excel Let , represent the mean weight on Scale 1 and P H2- Part 1 of 4 (a) State the null and alternate hypotheses. Ho H: This hypothesis test is a (Choose one) test. Part 2 of 4 (b) Compute the P-value. Round the answer to at least four decimal places. P-value = Part 3 of 4 Determine whether to reject Ho. (Choose one) v the null hypothesis. Part: 3 / 4 Part 4 of 4 (c) State a conclusion. There (Choose one) - enough evidence to conclude that the the mean weight differs between the Scales.
.BmBaFing scales: In an experiment to determine whether there is a systematic difference between the weights obtained with two different scales, 10 rock specimens were weighed, in grams, on each scale. The following data were obtained: Specimen Weight on Scale 1 Weight on Scale 2 11.45 11.83 14.65 15.56 3 8.50 9.02 4 10.71 11.36 23.89 25.28 9.61 9.35 7. 14.14 13.79 6.79 6.91 13.02 13.32 10 20.35 20.70 Send data to Excel Let , represent the mean weight on Scale 1 and P H2- Part 1 of 4 (a) State the null and alternate hypotheses. Ho H: This hypothesis test is a (Choose one) test. Part 2 of 4 (b) Compute the P-value. Round the answer to at least four decimal places. P-value = Part 3 of 4 Determine whether to reject Ho. (Choose one) v the null hypothesis. Part: 3 / 4 Part 4 of 4 (c) State a conclusion. There (Choose one) - enough evidence to conclude that the the mean weight differs between the Scales.

Big Ideas Math A Bridge To Success Algebra 1: Student Edition 2015
1st Edition
ISBN:9781680331141
Author:HOUGHTON MIFFLIN HARCOURT
Publisher:HOUGHTON MIFFLIN HARCOURT
Chapter11: Data Analysis And Displays
Section11.3: Shapes Of Distributions
Problem 20E

Related questions
Question
Transcribed Image Text:Comparing scales: In an experiment to determine whether there is a systematic difference between the weights obtained with two different scales, 10 rock
specimens were weighed, in grams, on each scale. The following data were obtained:
Espatat
Specimen weight on Scale 1 Weight on Scale 2
11.45
11.83
14.65
15.56
3.
8.50
9.02
10.71
11.36
23.89
25.28
9.61
9.35
14.14
13.79
8
6.79
6,91
13.02
13.32
10
20.35
20.70
Send data to Excel
Let , represent the mean weight on Scale 1 and PHH2-
Part 1 of 4
(a) State the null and alternate hypotheses.
db
H:
This hypothesis test is a (Choose one) test.
Part 2 of 4
(b) Compute the P-value. Round the answer to at least four decimal places.
P-value =
Part 3 of 4
Español
Determine whether to reject Ho.
(Choose one) ▼
the null hypothesis.
db
Part: 3 / 4
Part 4 of 4
(c) State a conclusion.
There (Choose one) v enough evidence to conclude that the the mean weight differs between the Scales.
Expert Solution
This question has been solved!
Explore an expertly crafted, step-by-step solution for a thorough understanding of key concepts.

Step by step
Solved in 2 steps with 2 images

Recommended textbooks for you
Big Ideas Math A Bridge To Success Algebra 1: Stu…
Algebra
ISBN:
9781680331141
Author:
HOUGHTON MIFFLIN HARCOURT
Publisher:
Houghton Mifflin Harcourt
Big Ideas Math A Bridge To Success Algebra 1: Stu…
Algebra
ISBN:
9781680331141
Author:
HOUGHTON MIFFLIN HARCOURT
Publisher:
Houghton Mifflin Harcourt