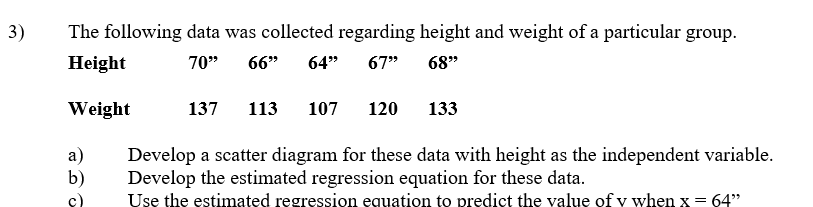
3) The following data was collected regarding height and weight of a particular group. Height 70" 66" 64" 67" 68" Weight 137 113 107 120 133 а) b) Develop a scatter diagram for these data with height as the independent variable. Develop the estimated regression equation for these data. Use the estimated regression equation to predict the value of y when x = 64"


Q: Teachers in a certain private school have a mean age of 38 years with a standard deviation of 6…
A: Solution: Given information: Teachers ages mean and standard deviation are Mean = μ1= 38Standard…
Q: A Department of Motor Vehicles office claims that the mean wait time is less than 14 minutes. A…
A: It is given that Sample size n = 10 Sample mean M = 13 Sample SD s = 3.5 Level of significance =…
Q: Suppose that the mean height of Grade 11 male students in a certain school is 170 cm, and that the…
A:
Q: Congratulations. You have just inherited your uncle's business, which is a clothing store. A…
A: Hello! As you have posted more than 3 sub parts, we are answering the first 3 sub-parts. In case…
Q: In words, define the random variable X, = b. Ho: and X2 = а. с. На: d. The level of significance is…
A: Using 5% level of significance, we need to conduct a hypothesis test to determine if strict measures…
Q: Gonif International sells vacation time shares using Internet banner ads. They want to test the…
A: Hello! Thanks for the question. We are providing the solution for finding the sample size. For…
Q: You have 169 light bulbs whose lifetimes are independent normal random variables with mean…
A:
Q: Eagles always lay three eggs at a time. The number of eggs that hatch is described by the following…
A: Create a histogram Find mean =?
Q: (a) Describe the Binomial random variable for 4 trials. What are the possible outcomes? (b) Give an…
A: A random variable X is said to follow the binomial distribution if it assumes only non-negative…
Q: Chi-Squared lest A car dealer suspects that the weather of the day of the test drive has an effect…
A: Given:
Q: computer start-up company named Pear is considering entering the Philippine market with what they…
A:
Q: A comparison is made between two bus lines to determine if arrival times of their regular buses from…
A: There are two independent samples which are bus line A and bus line B. We have to test whether there…
Q: Set background 1 Open om Clear frame 6. The figure below is a contingency table showing the counts…
A: The contingency table of the degree level and the recipient's gender is given below: Bachelor…
Q: Just need help with number 31
A: 31. Given :
Q: a survey, 27 people were asked how much they spent on their child's last birthday gift. The results…
A:
Q: Lahey Motors specializes in selling cars to buyers with a poor credit history. Listed is the number…
A: Given: n = 36
Q: flip a fair coin. If it is tails I roll a four sided die (1,2,3,4) and if it is heads I roll a six…
A: Given: I flip a fair coin. If it is tails I roll a four sided die (1,2,3,4) and if it is heads I…
Q: Two professors at a local college developed a new teaching curriculum designed to increase students'…
A:
Q: Determine the area under the standard normal curve that lies to the right of (a) Z=−0.32, (b)…
A: From the provided information, The area is under the standard normal curve that lies to the right of…
Q: Current Attempt in Progress Please use the accompanying Excel data set or accompanying Text file…
A: Given that Data of 2000 and 2001 is given We have to find the a...Correlation coefficient between…
Q: The manufacturer of a sports car claims that the fuel injection system lasts 48 months before it…
A: For the given data Perform t test for one sample mean
Q: Find the area to the right of 15.09 under the x2-curve with 10 degrees of freedom. Note that this is…
A: Given; random variable x from chisquare distribution with degrees of freedom=10 Then to find area…
Q: r an indifference curve through the consumption bundle (100,100) (solve for X2 on the ft hand side…
A:
Q: Random variables X and Y are connected through pgf ¤x(s) and Vy(s) by the relation x(s) = s¥y(/s)…
A:
Q: Here is a bivariate data set. x y 52.1 29.4 74.3 -20.5 35.4 36.8 23.8 22.5 61.1 -28.6…
A: For the given data Find r = ? R² = ? %
Q: A homeowner plants 6 bulbs selected at random from a box containing 5 tulip bulbs and 4 daffodil…
A: A homeowner plants 6 bulbs selected at random from a box containing 5 tulip bulbs and 4 daffodil…
Q: Giving a test to a group of students, the grades and gender are summarized below A B C Total…
A: Given :
Q: The sample size needed to estimate a population mean within 1.5 units with a 99% confidence when the…
A: From the provided information, Population standard deviation (σ) = 8 and E = 1.5 Confidence level =…
Q: O Help One graph in the figure represents a normal distribution with mean u= 15 and standard…
A: Here's first one mean is 15 and standard deviation is 1. Other graph has mean is 10 and standard…
Q: For a population data set, = 15.5 How large a sample should be se 95% confidence interval for H is…
A: For a population data set σ=15.5 Margin of error=3.25 α=0.05
Q: If x is a binomial random variable, compute p(x) for each of the cases below. a.n=5, x=1, p= 0.3 b.…
A: Since you have posted a question with multiple sub-parts, we will solve first three subparts for…
Q: Twenty years ago, 47% of parents of children in high school felt it was a serious problem that high…
A: Given that Sample size n =900 Population proportion p=47%=0.47
Q: 4. Y = 0.43X + 1.1; X = 0.97 5. Y = X +:X = 6. Assume that the height of fathers (X) and the height…
A:
Q: Here are summary statistics for randomly selected weights of newborn girls: n=170, x= 27.6 hg, s=…
A: From the given information we find the 95% confidence interval.
Q: Based on this sample, you seek to answer the following questions (excel please! Thank you!): 1.…
A: Hello! As you have posted more than 3 sub parts, we are answering the first 3 sub-parts. In case…
Q: Phone Battery Life. Battery life between charges for a certain mobile phone is 20 hours when the…
A:
Q: If you conduct 14 different statistical tests with alpha = 0.05, what is the probability you will…
A: Given that the researcher conducts 14 different statistical tests, each with an alpha is 0.05. That…
Q: Three different washing solutions are being compared to study their effectiveness in retarding…
A: Since you have posted a question with multiple sub-parts, we will solve the first three sub-parts…
Q: You wish to test the following claim (HaHa) at a significance level of α=0.01 Ho:μ1=μ2…
A: To test the claim (Ha) at a significance level of α=0.01 Null hypothesis, Ho:μ1=μ2…
Q: Part 1 If the level of employee satisfaction drops below 0.60 overall, then there is a belief that…
A: Hi, there! As per the multiple subparts rule, we are answering first three subparts. Kindly repost…
Q: Which of the following sampling techniques is considered as a method of probability sampling? A…
A: Non Probability Sampling: If a sample is not chosen based on probability known as the method of…
Q: As a manager of a certain restaurant, you want to conduct a study on the average waiting time before…
A: According to the given information, we have Margin of error = 2 Population standard deviation = 15
Q: The Wilson family had 9 children. ASsuming that the probability of a child being a girl is 0.5, find…
A:
Q: The numbers of regular season wins for 10 football teams in a given season are given below.…
A:
Q: a) Find the probability that there will be more than eight hurricanes next year. b) State the type…
A: here given, in recent twenty year period 190 hurricanes struck the united state
Q: 12. Teachers' Salaries in North Dakota The average teacher's salary in North Dakota is $37,764.…
A: Given that mean =37764 , s.d = 5100
Q: Who is the better player based on mean score? Who is the more consistent player? Why?
A: Here use basic of mean , and measure of consistency
Q: Ages Number of students 15-18 3 19-22 7 23-26 10 27-30 5 31-34 3 35-38 8 Based on the frequency…
A:
Q: Evaluate the following formula for p1−p2=0, p=0.140000, q=1−p, x1=69, x2=15, n1=316, n2=284,…
A: Given P-bar=0.140000 n1=316 n2=284
Q: If a customer selects 3 cartridges at random from the shelf, what is the probability that they are…
A: It is given that Total cartridges = 80 Number of defectives = 8 Sample size = 3


Trending now
This is a popular solution!

Step by step
Solved in 2 steps with 2 images

- Olympic Pole Vault The graph in Figure 7 indicates that in recent years the winning Olympic men’s pole vault height has fallen below the value predicted by the regression line in Example 2. This might have occurred because when the pole vault was a new event there was much room for improvement in vaulters’ performances, whereas now even the best training can produce only incremental advances. Let’s see whether concentrating on more recent results gives a better predictor of future records. (a) Use the data in Table 2 (page 176) to complete the table of winning pole vault heights shown in the margin. (Note that we are using x=0 to correspond to the year 1972, where this restricted data set begins.) (b) Find the regression line for the data in part ‚(a). (c) Plot the data and the regression line on the same axes. Does the regression line seem to provide a good model for the data? (d) What does the regression line predict as the winning pole vault height for the 2012 Olympics? Compare this predicted value to the actual 2012 winning height of 5.97 m, as described on page 177. Has this new regression line provided a better prediction than the line in Example 2?The accompanying data resulted from an experiment in which weld diameter and shear strength (in pounds) were determined for five different spot welds on steel. Below are the data collected and the regression equation. Diameter Strength 200.1 813.7 210.1 785.3 220.1 960.4 230.1 1118.0 240.0 1076.2 Strength = -941.6992 + 8.5988*Diameter The predicted y-hat value for a diameter of 201 is 864. if we observed a weld that had a diameter of 235 that had a strength 1000, what would be its residual?A study of the amount of rainfall and the quantity of air pollution removed produced the following data shown in table below: Daily Rainfall x (0.01 cm) Particulate Removed y (μg/m3) 7 126 7.9 129.3 7.5 125.3 9.2 120.2 10.8 116.7 5.8 119.2 5.6 138.7 2.7 147.5 9.2 110.3 Compute and interpret the coefficient of determination, and coefficient of correlation for the given data. What will be the regression equation, when swapped depended and independent variable
- The Update to the Task Force Report on Blood Pressure Control in Children [12] reported the observed 90th per-centile of SBP in single years of age from age 1 to 17 based on prior studies. The data for boys of average height are given in Table 11.18. Suppose we seek a more efficient way to display the data and choose linear regression to accomplish this task. age sbp 1 99 2 102 3 105 4 107 5 108 6 110 7 111 8 112 9 114 10 115 11 117 12 120 13 122 14 125 15 127 16 130 17 132 Do you think the linear regression provides a good fit to the data? Why or why not? Use residual analysis to justify your answer. Am I supposed to run a residual plot and QQ-plot for this question?Interpret the estimated regression coefficient corresponding to the Z variable. Data Salary Education Experience Sex 29.7985 15 3 1 21.8219 4 0 0 22.8978 4 0 0 22.0917 1 1 0 21.8993 5 0 0 22.4829 3 1 1 28.0772 15 0 0 y=salary 23.6292 6 1 1 x1=education level in schooling years 32.3595 0 15 1 x2=experience level in employment level 21.794 1 0 0 d=sex (1 for male,0 for female) 19.8762 3 0 0 Ln(Y) = alpha +beta1X1 +Beta2X2+ Beta3D +Beta4Z +e 21.0253 3 0 0 where z =X2D 24.6323 0 5 1 19.0247 0 0 0 18.8857 0 0 0 21.8552 1 0 0 24.2675 6 1 0 18.7931 0 0 0 18.9276 0 0 0 23.4441 5 1 1 20.8047 2 0 0 18.26 0 0 0 20.6726 0 2 1 21.7815 3 0 0…4.For a sample of 12 observations, a businessman wants to regress the price (in dollar) of the laptop (Y) on the processor's speed (X). The summary results of the observations are given below. Σx = 19.8 , Σy = 24798, Σxy = 431882 Σx^2 = 33.88, Σγ^2 = 57365692 (b)Find the fitted regression line of the price of laptop on processor speed. (c) Find the predicted price of the laptop (y) for the processor speed x-1.9. (d) Compute the coefficient of determination and comment.
- Given are five observations collected in a regression study on two variables. xi 2 6 9 13 20 yi 7 18 9 26 23 Develop the estimated regression equation for these data. ŷ = (c) Use the estimated regression equation to predict the value of y when x = 20.Which of the following does not need to be computed to determine a simple regression line? SSx SP "Y-hat" SSyFollowing is a portion of the regression output for an application relating maintenance expense (dollars per month) to usage (hours per week) for a particular brand of computer terminal. question 12 attached in ss below thanks for elp appreiacted
- Given are five observations collected in a regression study on two variables. xi 2 6 9 13 20 yi 9 18 8 25 21 (b) Develop the estimated regression equation for these data. ŷ = (c) Use the estimated regression equation to predict the value of y when x = 13.The following data shows the dexterity test scores of five assembly-line employees of Dimples Company Limited and their respective hourly productivity.Employee Score on dexterity test (?) Ali 12Kofi 14Kwesi 17Abudu 16Nana 11Units produced in an hour (?) 55636770 51You are required to(i) Write the regression equation(ii) Interpret the regression equation(iii) Calculate the Pearson’s Product Moment Correlation Coefficient.(iv) Interpret the correlation coefficient (v) Suppose the dexterity test score is 13, what would be the units produced in an hour? (vi) Clearly explain (in detail) the difference between regression analysis and correlation analysis.The regional transit authority for a major metropolitan area wants to determine whether there is any relationship between the age of a bus and the annual maintenance cost. A sample of 10 buses resulted in the data in Worksheet 2. Worksheet 2 Age of a Bus (years) Maintenance Cost ($) 1 350 2 370 2 480 2 520 2 590 3 550 4 750 4 800 5 790 5 950 Develop a scatter diagram with the age of a bus as the independent variable. Develop the estimated regression equation that can be used to predict the maintenance cost given the age of a bus. Determine the coefficient of determination, and interpret its meaning in this problem. At the 0.05 level of significance, is there evidence of a linear relationship between the age of a bus and the annual maintenance cost.
