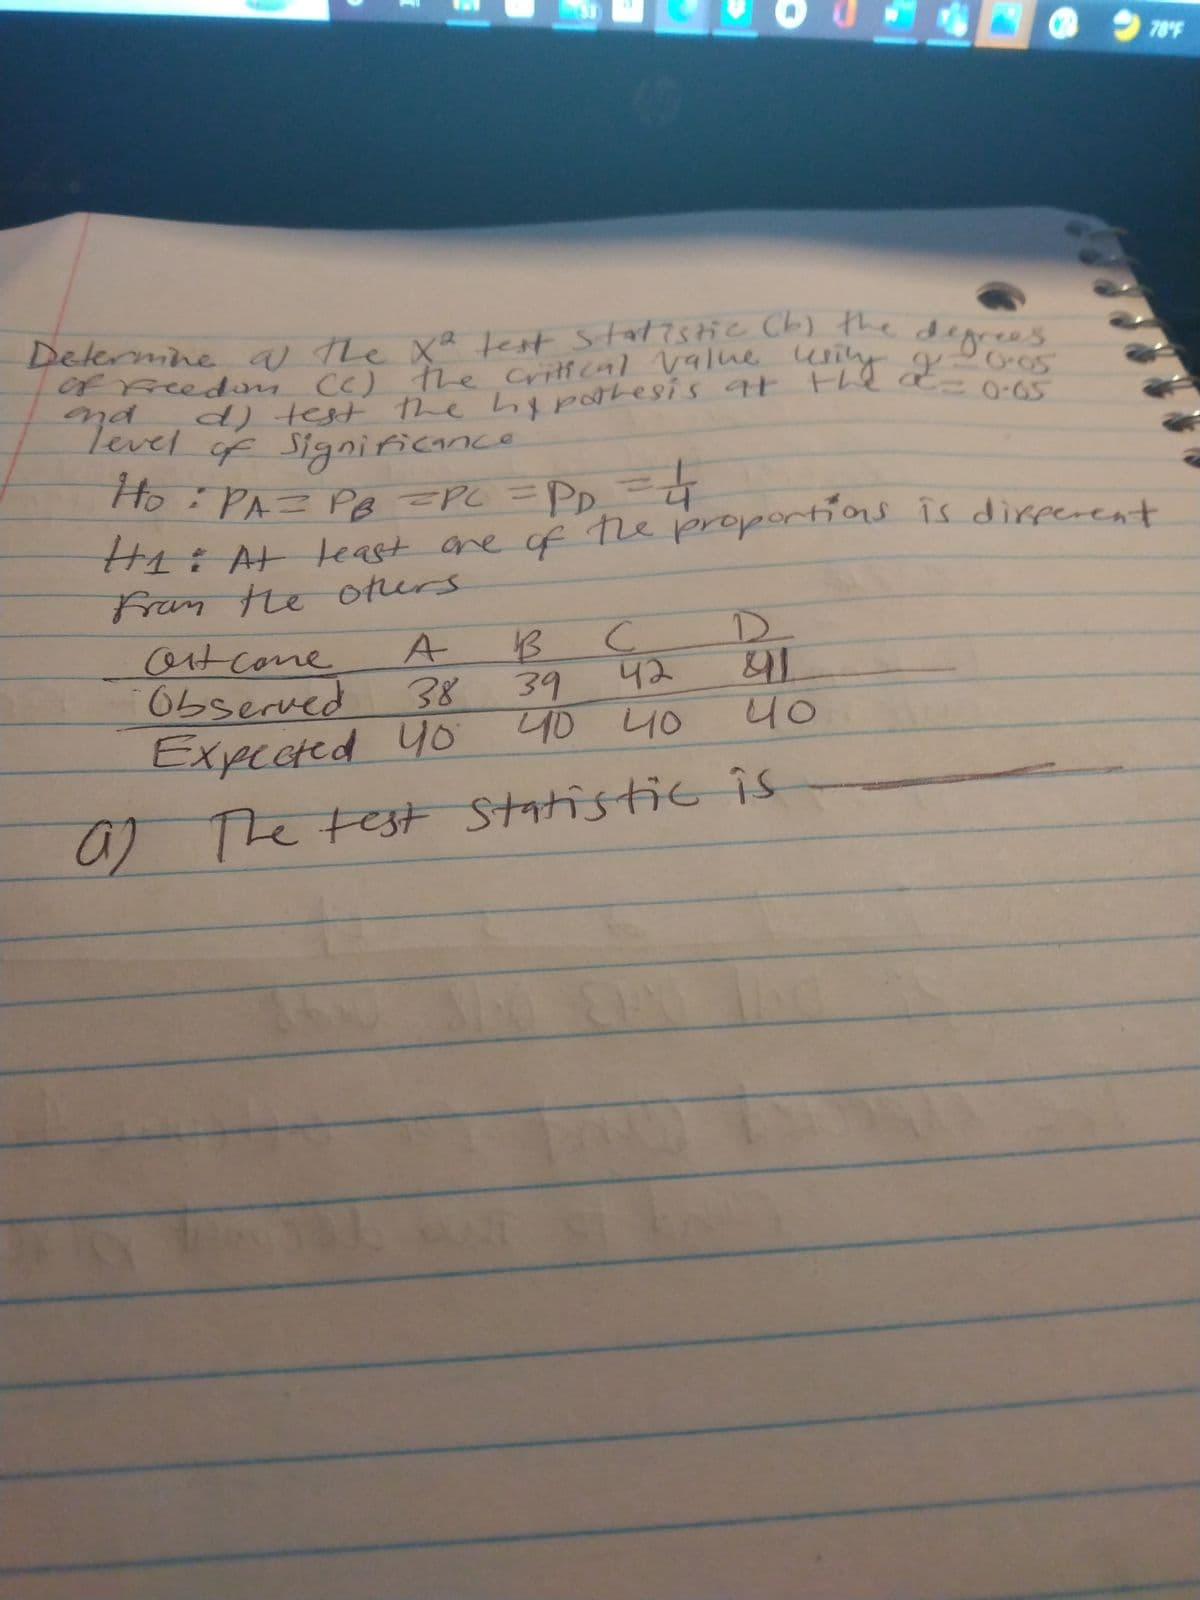
0.65 Determine of the X² test Statistic (b) the degrees d) test the hypothesis at the at = 0.05 level of significance of Freedom (c) the critical value usity and H₂ = PA = PB =PL = PD, = 4 H₁: At least one of the proportions is different from the others. A B с 39 42 что чо 91 40 Outcome Observed 38 Expected yo a) The test Statistic is


Q: How many arrangements can be made using all of the letters of the word MISSISSIPPI if: the…
A: Given that: Word: MISSISSIPPI To find: Number of arrangements begin with 3I's, there are two cases:…
Q: A group of 300 people are being split into teams of 3 (where order of teams and order within a team…
A: nCr=n!r!n-r!
Q: 15. Consider this upper-tail hypothesis test: Ho: p ≤ 0.70 against H₁: p > 0.70. If a random sample…
A:
Q: How many subsets of a set with 50 elements have more than one element?
A: Introduction: Here we need to find how number of subsets have more than 1 element. Given:…
Q: 1. b) True False For a Binomial Distribution, the probability of success is always 1/2.
A: In Binomial distribution, there are two parameters n, number of trials and p, probability of…
Q: Assume that a randomly selected subject is given a bone density test. Those test scores are normally…
A: According to the given information in this question Mean is 0 Standard deviation is 1 We need to…
Q: You wish to test the following claim (Ha) at a significance level of α=0.001. For the context of…
A: Hypotheses: H0:μd=0Ha:μd≠0 claim
Q: b. Identify the sample proportion and use the symbol that represents it. A Р (Type an integer or a…
A: b.) The sample proportion is represented by the symbol p^.
Q: b) What is the probability that is less than 2.7 grams? 0.3085 0.6915 0.9982 0.0018
A: The following information has been given: μ=3.1σ=0.8n=34 We need to compute P(x¯<2.7) Let X be a…
Q: Consider the following hypothesis test: Ho: μ = 15 Ha: #15 A sample of 50 provided a sample mean of…
A: a. Suppose μ is the population mean.
Q: A sample of years to maturity and yield for 40 corporate bonds taken from Barron's is given below.…
A: Given that: Years to Maturity, x Yield, y 1.25 2.264 7.75 3.773 23.5 2.143 25 1.422 19…
Q: e table below shows the scores on a Chem 103 test consisting of 10 questions worth 10 points each.…
A: Graphs are used for visual representation of the data set. Graphs are used for easy representation.…
Q: Consider the following hypothesis test: A sample of 140 is used and the population standard…
A: Since you have posted a question with multiple sub-parts, we will solve first three subparts for…
Q: Determine if using the z distribution/ t distribution in each of the following problems. 1. A 98%…
A: 1) The sample standard deviation is 18 and the population standard deviation is unknown.
Q: You wish to test the following claim (H) at a significance level of a = 0.05. Ηο: μ = 79.2 Ha: 79.2…
A:
Q: Brand A Brand B 35 50 25 55 22 62 38 68 40 57 28 70 The prices of two different brands of…
A: Given data: Brand A 35 25 22 38 40 28 Brand B 50 55 62 68 57 70
Q: What is the lower bound of a 90% confidence interval for the percent of the population that would…
A: here given , In a sample of 235 people, 40% responded they would vote for candidate A. p^ = 0.40…
Q: The graph below shows five black bars. Adjust the light bar so that it has the mean height of the…
A: From the given diagram, the y axis (frequency) ranges from 0 to 15. The frequency of the first bar…
Q: ОВ. НЕ H₁: F
A: we have given data of simple random sample of front-seat occupants involved in car crashes n1=2806…
Q: Consider the following game, נין A D D 5,5 0. PI E 4,0 1. a) Name the actions of PI that are the…
A: Game Theory: Useful in analyzing situations where outcomes depend on a person's decision based on…
Q: Fill in the table. Interval number 1 2 3 4 5 6 Probability the true value of Confidence Level (C)…
A: The confidence interval is the range of values within which the population parameter is expected to…
Q: Use the provided randomization distribution (based on 100 samples) to estimate the p-value for this…
A:
Q: Let X₁, X₂,...,Xn be a random sample of size, n from a normal distribution with mean, and variance,…
A:
Q: Is fishing better from a boat or from the shore? Pyramid Lake is located on the Paiute Indian…
A:
Q: variance.
A: Given information: X ~ Normal distribution P (X ≤ 66) = 0.0421 and P (X ≥ 81) = 0.1298
Q: 1 2 3 4 5 6 7 7 8 9 10 11 12 13 14 15 16 Williams Smith Logan 1 1 1 Alexander 1 1 1 2 S Oliver…
A: Since you have posted a question with multiple sub-parts, we will solve the first three sub-parts…
Q: DDonuts claims that the waiting time of customers for service is normally distributed with a mean of…
A: Parametric test are one of the hypothesis test. It used to make conclusion about the larger…
Q: CLT
A: Given: Population = Lizards Population mean = μ = 3.1 Population Standard Deviation = σ = 0.8 Sample…
Q: Suppose that A and B are two events for which P(A)=0.26, P(B)=0.76, and P(B|A)=0.51. Find each of…
A:
Q: A businessman calculated the average price of variety A rice per kilo at ₱32.00 with a standard…
A: First calculate sample mean and sample standard deviation for rice B varieties using Excel
Q: The following sample observations were randomly selected. (Round intermediate calculations and final…
A: To find: 1. The regression equation 2. When x is 5 find value : y = ?
Q: Bicycling, the world's leading cycling magazine, reviews hundreds of bicycles throughout the year.…
A: Given, Bicycle brands weight and the price is provided, Weight Price ($) 17.8 2100 16.1 6250…
Q: 5. Suppose that the heights (in inches) of adult males in Tanjung Malim are believed to be normally…
A: The question is about confidence interval Given : Randomly selected no. of adult males ( n ) = 25…
Q: Confidence intervals for population proportions are for categorical data, which satisfies all the…
A: The formula to find the confidence interval for population proportion is, CI=p^±zα2p^1-p^n where, p^…
Q: An archeologist has found 19 intact specimens of a certain prehistoric artifact. Although she finds…
A: Given that: Data: 17.3 18.9 17.7 23.8 16.0 22.1 18.4 18.2 13.3 26.8 18.6 24.5 22.8 13.4 18.1 14.8…
Q: Assume the random variable x is normally distributed with mean = 90 and standard deviation a=5. Find…
A: The following information has been given: μ=90σ=5 We need to compute Px<83.
Q: 1. c) southwestern variable. True False The daily fuel consumption by a fleet of buses serving a…
A: Here we have to check whether given statement is true or false " The daily fuel consumption by a…
Q: Find the area of the indicated region under the standard normal curve. Click here to view page 1 of…
A:
Q: Step-by-step software procedure for summary in MINITAB software is as follows: • Choose Stat >>…
A: The data is as follows: Los angeles office rental rates Dallas office rental rates 51 18 47…
Q: A Certain flight arrives on time 86 percent of the time. Suppose 183, Flights are randomly…
A: Givenn=183p=0.86
Q: 15 mothers were asked which brand of milk they prefer for their children. The choices are Nido,…
A: "A certainty span is a scope of values that is probably going to incorporate" the "populace…
Q: Bias from the sampling process (like using a convince sample) is taken into account in interval. If…
A: Given Solution:
Q: cific phthalate byproducts were measured (in ng/mL) in the urine: DEHP and DiNP. Find a 95%95%…
A: Given: x1=83.6,s1=194.7,n1=3095x2=59.1,s2=152.1,n2=5782 Sample size are sufficient for normal…
Q: Tourism is extremely important to the economy of Florida. Hotel occupancy is an often-reported…
A: Given data: Current Year Previous year Occupied rooms 1512 1458 Total rooms 1800 1800
Q: A survey conducted by the American Automobile Association (AAA) showed that a family of four spends…
A: Given that: Population mean, μ=215.60 n = 64 x¯=252.45 s = 74.50
Q: (a) Find the probability that a study participant has a height that is less than 65 inches. The…
A: It is given that Mean, μ = 69.3 Standard deviation, σ = 3 Z-Score, Z = ( X - μ )/σ
Q: Find the value of Z q 20.23
A: Solution: Let Z be the standard normal variable with mean 0 and standard deviation 1. Z~N(0,1)
Q: what do you call this sampling technique?
A: Posting a question on the internet to know about something
Q: 3. Calculate the coefficient of skewness of the following frequency distributions, given their…
A:
Q: Q.2 (а) Three marbles are drawn without replacement form an urn containing 4 red and 6 white…
A: Given that: Number of red marbles = 4 Number of white marbles = 6 X denotes the number of red…

Step by step
Solved in 3 steps

- 1.Test the hypothesis that β2=0 against the hypothesis that β2<0 at α=0.01. Assuming a standard error of 0.063935 the test statistic is and the critical value is?2.The above suggests that the null hypothesis... A. is not rejected. B. is rejected3.Conduct a t-test at the .01 level. What is the critical value? (A) 1.645 for a one-tailed test (B) -1.645 for a one-tailed test (C) 1.960 for a one-tailed test (D) -1.960 for a one-tailed test (E) 2.326 for a one-tailed test (F) -2.326 for a one-tailed test (G) 2.576 for a one-tailed test (H) -2.576 for a one-tailed test (I) 1.645 and -1.645 for a two-tailed test (J) 1.960 and -1.960 for a two-tailed test (K) 2.576 and -2.576 for a two-tailed test10. Determine the F statistics (write the result in X.XX) 11. Determine the critical value, F for alpha of .05 (write the result in X.XX) 12. Conclude and discuss the result
- Determine the critical value of χ2 with 1 degree of freedom for α=0.01. The critical value of χ2 is _________.(Round to three decimal places as needed.)H0 : ρ =0 H1 : ρ > 0 rn α =0.529=15=0.05 a. Calculate the test statistic. t= Round to three decimal places if necessary b. Determine the critical value(s) for the hypothesis test. = Round to three decimal places if necessary c. Conclude whether to reject the null hypothesis or not based on the test statistic. Reject Fail to RejectA consumer goods company is developing a new shampoo and is interested in foam height (in millimeters). Foam height is regularly distributed, with a standard variation of 18 millimeters and a sample mean of 190 millimeters. Using 40 samples, the maker aims to test the hypothesis that the population mean is bigger than 180 millimeters. Use an alpha of 0.05. a. The critical value is Z b. The test statistic is Z c. Decision is to ___ the null hypothesis (accept or reject)
- Determine the critical value of χ2 with 1 degree of freedom for α=0.005. The critical value of χ2 is _____Tests the claim that p1>p2. Assume the samples are random and independent.x1=55 ; x2=24n1=99 ; n2=100 1.) At α=0.011 , Use the distribution table to find the critical values for the rejection regionZc=Consider the null hypotheses for the following multinomial experiments. (Give your answers correct to two decimal places.) (a) Determine the critical value and critical region that would be used in the classical approach to test Ho: P(1) = P(2) = P(3) = P(4) = 0.25, with a = 0.1.x2 (b) Determine the critical value and critical region that would be used in the classical approach to test Ho: P(1) = 0.25, P(2) = 0.40, P(3) = 0.35, with a = 0.1.x2
- A researcher is interested in testing whether annual house hold income in Philadelphia is normal. So she took a sample of 50 house holds and found that skewness (s)= 2.3190 and Kurtosis (k) = 6.7322. Use the Jarque- Bera Test to test , at alpha 0.05, whether income follows normal distribution. -Yes, population is normal because Chi-Square test is higher than critical value. -Yes, population is normal because Chi-Square test is less than critical value. -No, population is not normal because Chi-Square test is higher than critical value. -No, population is not normal because Chi-Square test is less than critical value.Area to the Right of the Critical Value Degrees of Freedom 0.995 0.99 0.975 0.95 0.90 0.10 0.05 0.025 0.01 0.005 Degrees of Freedom 1 - - 0.001 0.004 0.016 2.706 3.841 5.024 6.635 7.879 1 2 0.010 0.020 0.051 0.103 0.211 4.605 5.991 7.378 9.210 10.597 2 3 0.072 0.115 0.216 0.352 0.584 6.251 7.815 9.348 11.345 12.838 3 4 0.207 0.297 0.484 0.711 1.064 7.779 9.488 11.143 13.277 14.860 4 5 0.412 0.554 0.831 1.145 1.610 9.236 11.071 12.833 15.086 16.750 5 6 0.676 0.872 1.237 1.635 2.204 10.645 12.592 14.449 16.812 18.548 6 7 0.989 1.239 1.690 2.167 2.833 12.017 14.067 16.013 18.475 20.278 7 8 1.344 1.646 2.180 2.733 3.490 13.362 15.507 17.535 20.090 21.955 8 9 1.735 2.088 2.700 3.325 4.168 14.684 16.919 19.023 21.666 23.589 9 10 2.156 2.558 3.247 3.940 4.865 15.987 18.307 20.483 23.209 25.188 10 11 2.603 3.053 3.816 4.575 5.578 17.275 19.675 21.920 24.725 26.757 11 12 3.074 3.571 4.404 5.226 6.304 18.549 21.026 23.337 26.217 28.299 12 13 3.565 4.107 5.009 5.892 7.042 19.812 22.362 24.736…alpha = 0.05 level, Compute the test statistics: alpha = 0.05 level, determine the appropriate technique (test): alpha = 0.05 level, determine the critical value: alpha = 0.05 level, what is the decision? (reject Ho or do not reject Ho)
