15. Consider this upper-tail hypothesis test: Ho: p ≤ 0.70 against H₁: p > 0.70. If a random sample of n = 800 provides a sample proportion of 0.76, what is the test statistic Z? 2.185478 2.384158 3.973597 3.377558 A. B. C.
15. Consider this upper-tail hypothesis test: Ho: p ≤ 0.70 against H₁: p > 0.70. If a random sample of n = 800 provides a sample proportion of 0.76, what is the test statistic Z? 2.185478 2.384158 3.973597 3.377558 A. B. C.

College Algebra (MindTap Course List)
12th Edition
ISBN:9781305652231
Author:R. David Gustafson, Jeff Hughes
Publisher:R. David Gustafson, Jeff Hughes
Chapter8: Sequences, Series, And Probability
Section8.7: Probability
Problem 58E: What is meant by the sample space of an experiment?

Related questions
Question
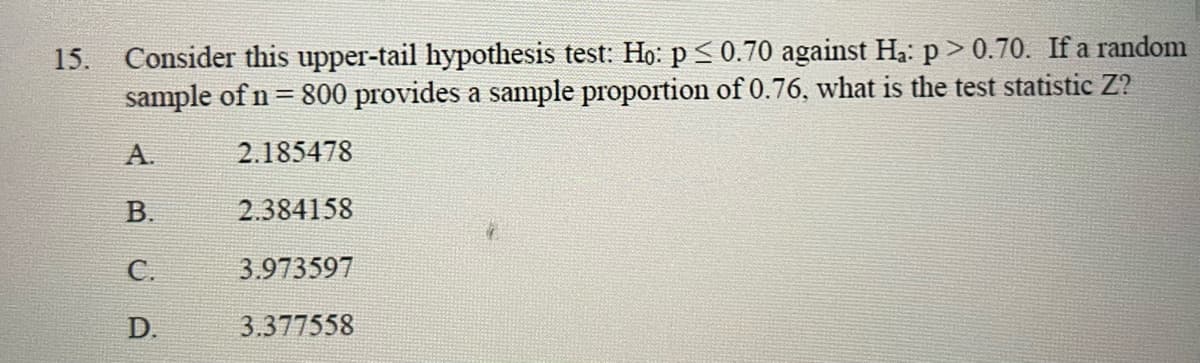
Transcribed Image Text:15. Consider this upper-tail hypothesis test: Ho: p ≤ 0.70 against Ha: p > 0.70. If a random
sample of n = 800 provides a sample proportion of 0.76, what is the test statistic Z?
2.185478
2.384158
3.973597
3.377558
A.
B.
C.
D.
Expert Solution
This question has been solved!
Explore an expertly crafted, step-by-step solution for a thorough understanding of key concepts.

Step by step
Solved in 2 steps

Recommended textbooks for you
College Algebra (MindTap Course List)
Algebra
ISBN:
9781305652231
Author:
R. David Gustafson, Jeff Hughes
Publisher:
Cengage Learning
College Algebra (MindTap Course List)
Algebra
ISBN:
9781305652231
Author:
R. David Gustafson, Jeff Hughes
Publisher:
Cengage Learning