01 A quality inspector took six samples each of four observations, of the length of time (minutes) it took to process loan applications at a credit union. Data for the exercise is provided below: Sample 3 12.15 12.12 1 2 4 5 12.12 12.09 12.14 12.11 12.11 12.09 12.14 12.10 12.10 12.09 12.10 12.11 12.08 12.10 12.11 12.08 12.13 12.11 12.11 12.15 12.10 12.12 Use the information to obtain two-sigma control limits for the means of future times. It is known from previous experience that the standard deviation of the process is 0.02 minute. Observation
01 A quality inspector took six samples each of four observations, of the length of time (minutes) it took to process loan applications at a credit union. Data for the exercise is provided below: Sample 3 12.15 12.12 1 2 4 5 12.12 12.09 12.14 12.11 12.11 12.09 12.14 12.10 12.10 12.09 12.10 12.11 12.08 12.10 12.11 12.08 12.13 12.11 12.11 12.15 12.10 12.12 Use the information to obtain two-sigma control limits for the means of future times. It is known from previous experience that the standard deviation of the process is 0.02 minute. Observation

Glencoe Algebra 1, Student Edition, 9780079039897, 0079039898, 2018
18th Edition
ISBN:9780079039897
Author:Carter
Publisher:Carter
Chapter10: Statistics
Section10.5: Comparing Sets Of Data
Problem 13PPS

Related questions
Question
Transcribed Image Text:01
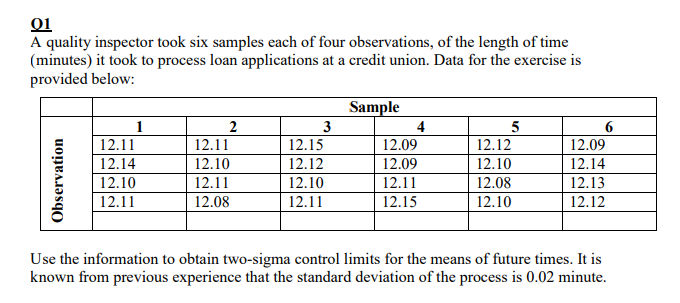
A quality inspector took six samples each of four observations, of the length of time
(minutes) it took to process loan applications at a credit union. Data for the exercise is
provided below:
Sample
3
1
2
4
12.11
12.11
12.15
12.09
12.12
12.09
12.14
12.10
12.12
12.09
12.10
12.14
12.10
12.11
12.10
12.11
12.15
12.08
12.13
12.12
12.11
12.08
12.11
12.10
Use the information to obtain two-sigma control limits for the means of future times. It is
known from previous experience that the standard deviation of the process is 0.02 minute.
Observation
Transcribed Image Text:02
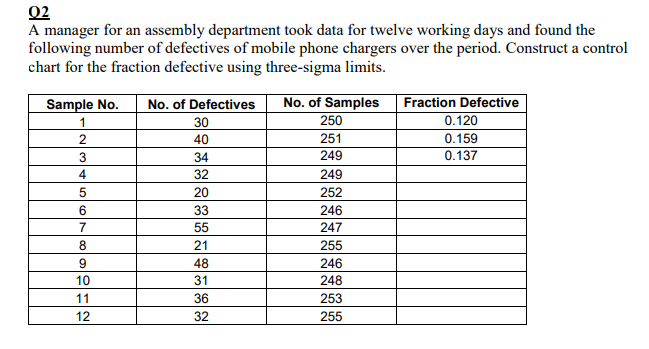
A manager for an assembly department took data for twelve working days and found the
following number of defectives of mobile phone chargers over the period. Construct a control
chart for the fraction defective using three-sigma limits.
Sample No.
No. of Defectives
No. of Samples
250
Fraction Defective
1
30
0.120
40
251
0.159
3
34
249
0.137
4
32
249
20
252
33
246
7
55
247
8
21
255
48
246
10
31
248
11
36
253
12
32
255
Expert Solution
This question has been solved!
Explore an expertly crafted, step-by-step solution for a thorough understanding of key concepts.

This is a popular solution!

Trending now
This is a popular solution!

Step by step
Solved in 2 steps

Recommended textbooks for you
Glencoe Algebra 1, Student Edition, 9780079039897…
Algebra
ISBN:
9780079039897
Author:
Carter
Publisher:
McGraw Hill
Glencoe Algebra 1, Student Edition, 9780079039897…
Algebra
ISBN:
9780079039897
Author:
Carter
Publisher:
McGraw Hill