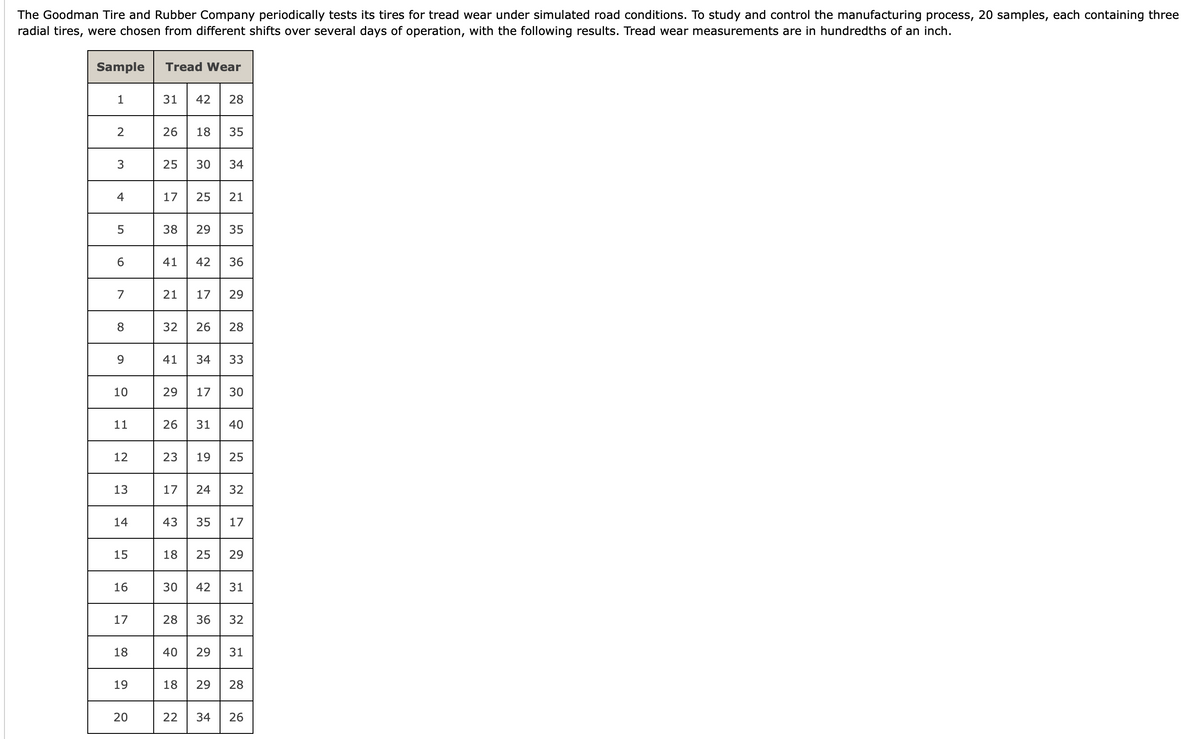
The Goodman Tire and Rubber Company periodically tests its tires for tread wear under simulated road conditions. To study and control the manufacturing process, 20 samples, each containing three radial tires, were chosen from different shifts over several days of operation, with the following results. Tread wear measurements are in hundredths of an inch. Sample Tread Wear 1 31 42 28 | 26 18 35 | 25 30 34 | 17 25 21 3 4 5 38 29 35 | 41 42 36 | 21 17 29 | 32 26 28 6 8 9 41 34 33 10 29 17 30 11 26 31 40 12 23 19 25 13 17 24 32 14 43 35 17 15 18 25 | 29 16 30 42 31 17 28 36 32 18 40 29 31 19 18 29 28 20 22 34 26
The Goodman Tire and Rubber Company periodically tests its tires for tread wear under simulated road conditions. To study and control the manufacturing process, 20 samples, each containing three radial tires, were chosen from different shifts over several days of operation, with the following results. Tread wear measurements are in hundredths of an inch. Sample Tread Wear 1 31 42 28 | 26 18 35 | 25 30 34 | 17 25 21 3 4 5 38 29 35 | 41 42 36 | 21 17 29 | 32 26 28 6 8 9 41 34 33 10 29 17 30 11 26 31 40 12 23 19 25 13 17 24 32 14 43 35 17 15 18 25 | 29 16 30 42 31 17 28 36 32 18 40 29 31 19 18 29 28 20 22 34 26

College Algebra (MindTap Course List)
12th Edition
ISBN:9781305652231
Author:R. David Gustafson, Jeff Hughes
Publisher:R. David Gustafson, Jeff Hughes
Chapter8: Sequences, Series, And Probability
Section8.7: Probability
Problem 5E: List the sample space of each experiment. Rolling one die and tossing one coin

Related questions
Topic Video
Question
100%
Transcribed Image Text:The Goodman Tire and Rubber Company periodically tests its tires for tread wear under simulated road conditions. To study and control the manufacturing process, 20 samples, each containing three
radial tires, were chosen from different shifts over several days of operation, with the following results. Tread wear measurements are in hundredths of an inch.
Sample
Tread Wear
1
31
42
28
26
18
35
3
25
30
34
4
17
25
21
38
29
35
41
42
36
7
21
17
29
8.
32
26
28
9.
41
34
33
10
29
17
30
11
26
31
40
12
23
19
25
13
17
24
32
14
43
35
17
15
18
25
29
16
30
42
31
17
28
36
32
18
40
29
31
19
18
29
28
20
22
34
26
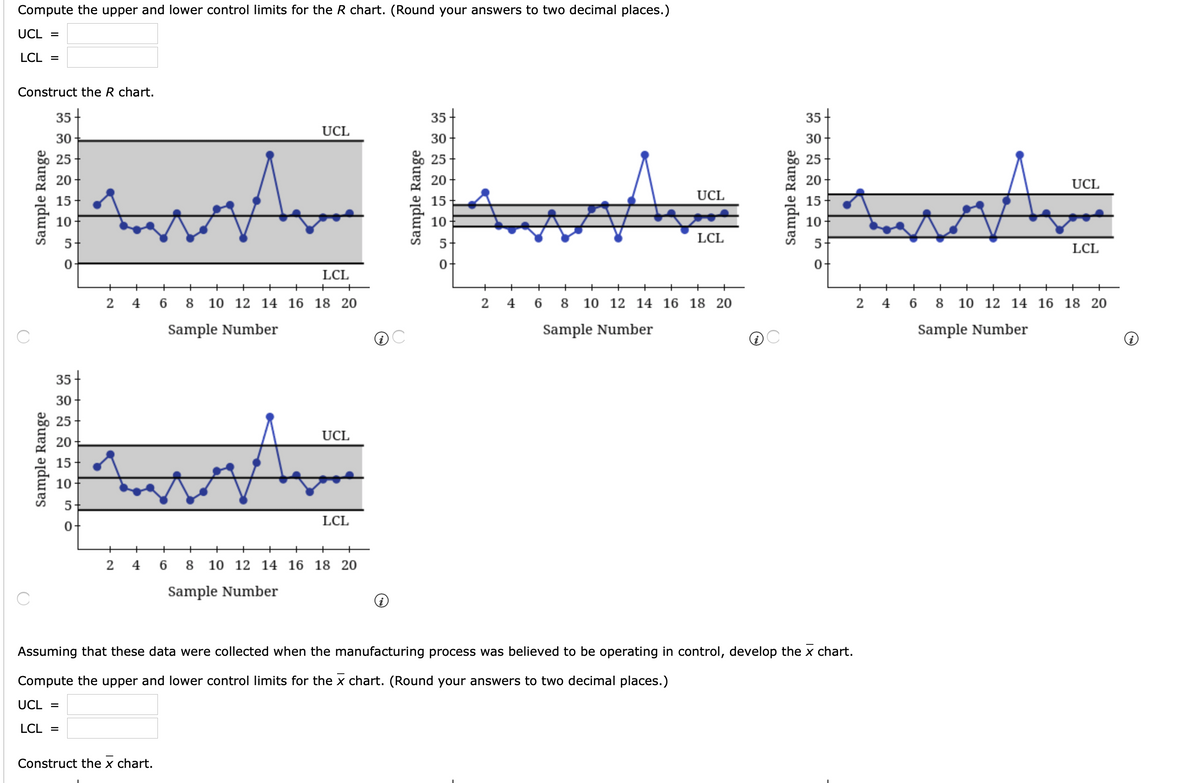
Transcribed Image Text:Compute the upper and lower control limits for the R chart. (Round your answers to two decimal places.)
UCL =
LCL =
Construct the R chart.
35
35
35+
UCL
30
30
30
25
25
20
20
UCL
UCL
15
15
15
10
10
10
LCL
5-
5
5
LCL
LCL
+
4 6
8 10 12 14 16 18 20
4 6 8 10 12 14 16 18 20
2 4
6 8 10 12 14 16 18 20
Sample Number
Sample Number
Sample Number
35
30
25
UCL
20
15
10
LCL
+
2
4
8 10 12 14 16 18 20
Sample Number
i
Assuming that these data were collected when the manufacturing process was believed to be operating in control, develop the x chart.
Compute the upper and lower control limits for the x chart. (Round your answers to two decimal places.)
UCL =
LCL =
Construct the x chart.
Sample Range
Sample Range
Sample Range
Sample Range
Expert Solution
This question has been solved!
Explore an expertly crafted, step-by-step solution for a thorough understanding of key concepts.

This is a popular solution!

Trending now
This is a popular solution!

Step by step
Solved in 3 steps with 3 images

Knowledge Booster


Learn more about
Need a deep-dive on the concept behind this application? Look no further. Learn more about this topic, statistics and related others by exploring similar questions and additional content below.Recommended textbooks for you
College Algebra (MindTap Course List)
Algebra
ISBN:
9781305652231
Author:
R. David Gustafson, Jeff Hughes
Publisher:
Cengage Learning
College Algebra (MindTap Course List)
Algebra
ISBN:
9781305652231
Author:
R. David Gustafson, Jeff Hughes
Publisher:
Cengage Learning