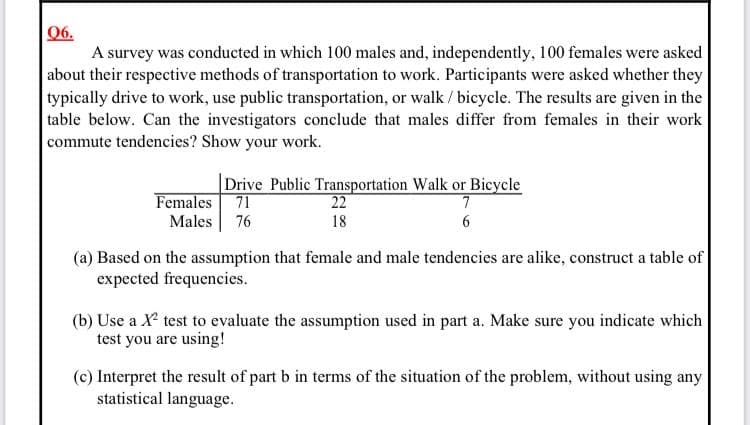
06. A survey was conducted in which 100 males and, independently, 100 females were asked about their respective methods of transportation to work. Participants were asked whether they typically drive to work, use public transportation, or walk / bicycle. The results are given in the table below. Can the investigators conclude that males differ from females in their work commute tendencies? Show your work. |Drive Public Transportation Walk or Bicycle 22 Females 71 Males 76 18 (a) Based on the assumption that female and male tendencies are alike, construct a table of expected frequencies. (b) Use a X test to evaluate the assumption used in part a. Make sure you indicate which test you are using! (c) Interpret the result of part b in terms of the situation of the problem, without using any statistical language.
06. A survey was conducted in which 100 males and, independently, 100 females were asked about their respective methods of transportation to work. Participants were asked whether they typically drive to work, use public transportation, or walk / bicycle. The results are given in the table below. Can the investigators conclude that males differ from females in their work commute tendencies? Show your work. |Drive Public Transportation Walk or Bicycle 22 Females 71 Males 76 18 (a) Based on the assumption that female and male tendencies are alike, construct a table of expected frequencies. (b) Use a X test to evaluate the assumption used in part a. Make sure you indicate which test you are using! (c) Interpret the result of part b in terms of the situation of the problem, without using any statistical language.

Algebra & Trigonometry with Analytic Geometry
13th Edition
ISBN:9781133382119
Author:Swokowski
Publisher:Swokowski
Chapter10: Sequences, Series, And Probability
Section10.8: Probability
Problem 32E

Related questions

Question
100%
Transcribed Image Text:06.
A survey was conducted in which 100 males and, independently, 100 females were asked
about their respective methods of transportation to work. Participants were asked whether they
typically drive to work, use public transportation, or walk / bicycle. The results are given in the
table below. Can the investigators conclude that males differ from females in their work
commute tendencies? Show your work.
Drive Public Transportation Walk or Bicycle
71
Females
22
7
Males 76
18
6
(a) Based on the assumption that female and male tendencies are alike, construct a table of
expected frequencies.
(b) Use a X test to evaluate the assumption used in part a. Make sure you indicate which
test you are using!
(c) Interpret the result of part b in terms of the situation of the problem, without using any
statistical language.
Expert Solution
This question has been solved!
Explore an expertly crafted, step-by-step solution for a thorough understanding of key concepts.

Step by step
Solved in 4 steps with 1 images

Knowledge Booster


Learn more about
Need a deep-dive on the concept behind this application? Look no further. Learn more about this topic, statistics and related others by exploring similar questions and additional content below.Recommended textbooks for you
Algebra & Trigonometry with Analytic Geometry
Algebra
ISBN:
9781133382119
Author:
Swokowski
Publisher:
Cengage
Algebra & Trigonometry with Analytic Geometry
Algebra
ISBN:
9781133382119
Author:
Swokowski
Publisher:
Cengage